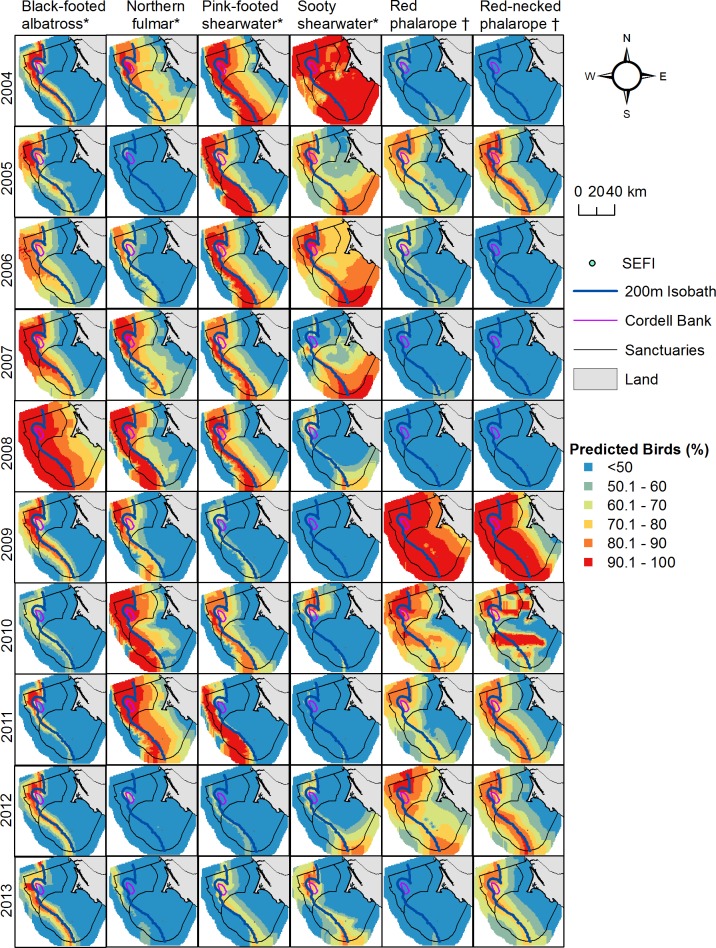
Fig 10. Annual seabird distributions.
Each species was standardized across years (2004–2013) using predicted values from the top three months of greatest abundance between May and October. Top months were: May, June, July (black-footed albatross); June, July, September (northern fulmar, pink-footed shearwater, sooty shearwater); July, September, October (red phalarope, red-necked phalarope). Map represents highest use foraging areas (upper 50 percent) for each species relative to year but independent of other species. Foraging type depicted by * (generalist) and † (planktivorous).

