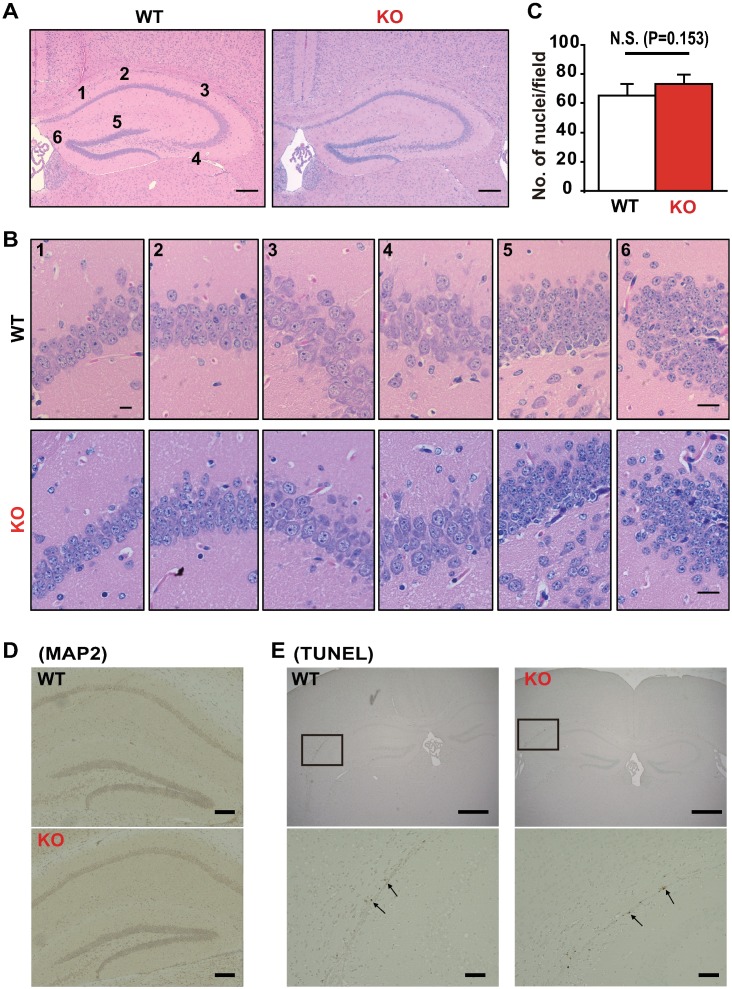
Fig 3. Morphology of mouse brains.
(A) Hematoxylin and eosin (HE) staining of cross-sections of the hippocampus from 6-week-old wild-type (WT) and Ncs1-/- (knock-out [KO]) mice. Scale bars = 200 μm. (B and C). We quantified cell number by counting the number of nuclei in six regions of the CA1, CA2, CA3 and DG (both the left and right side of the brain). Representative photographs are shown in (B) Scale bars = 20 μm. The average data for the number of nuclei obtained from the six regions in WT and KO mice (C). n = 6/group. There was no statistically significant difference between the WT and KO groups (P = 0.153). (D) Representative photographs of hippocampal cross-sections immunolabeled with the neuronal marker microtubule-associated protein (MAP2). Scale bars = 200 μm. (E) Representative photographs of a cross-section treated with terminal deoxynucleotidyl transferase biotin-dUTP nick end (TUNEL). The arrowheads indicate TUNEL-positive cells, suggesting apoptosis. Scale bars = 1 mm and 200 μm for upper and lower panels, respectively.

