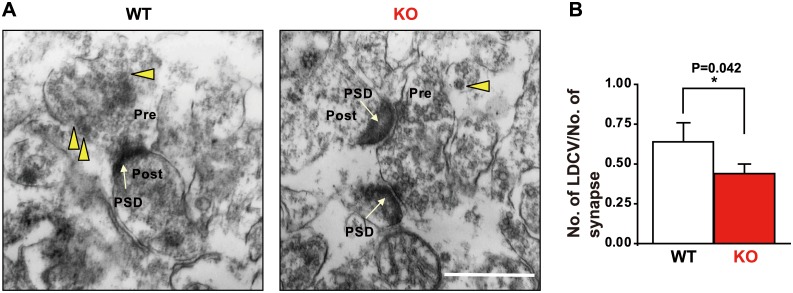
Fig 5. Ultrastructure of hippocampal CA1 neurons in wild-type (WT) and Ncs1-/- (knock-out [KO]) mice.
(A) Representative photographs visualized using transmission electron microscopy. Yellow arrowheads and white arrows indicate large dense core vesicles (LDCVs) and post synaptic densities (PSD), respectively. (B) Average data for the number of LDCVs per presynaptic terminal in WT and KO mice. Scale bar = 500 nm. Data are presented as means ± standard error of the mean; n = 82 and 87 synapses in the WT and KO group from 16 areas, respectively. The number of LDCVs per presynaptic terminal was lower in KO mice compared to WT mice (Student’s t-test, P = 0.042).

