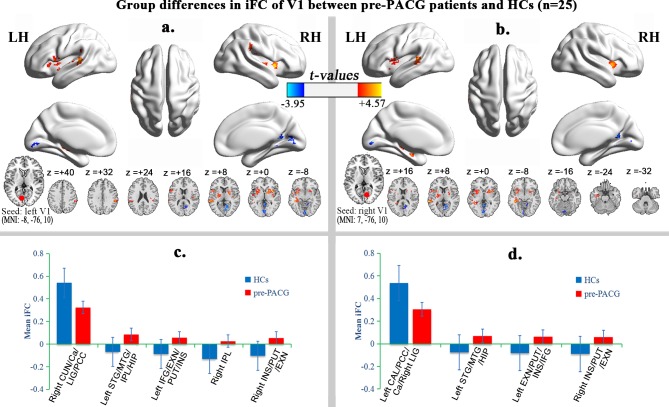
Fig 2. Alteration of iFC of V1 in pre-PACG patients.
Regions showing significant differences in iFC of the left (a) and right (b) V1 between the pre-PACG patients and HCs (one-tailed voxel-level P < 0.01 and cluster-level P < 0.05 with GRF correction). The hot (cool) color represents increased (decreased) iFC in the pre-PACG patients compared with the HCs. Spatial distribution was visualized using surface brain imaging in BrainNet Viewer (www.nitrc.org/projects/bnv/) and DPABI slice viewer (http://rfmri.org/dpabi). Bar plot of the iFC of the left V1 (c) and the right V1 (d) for the significant clusters in the pre-PACG patients vs. HCs.

