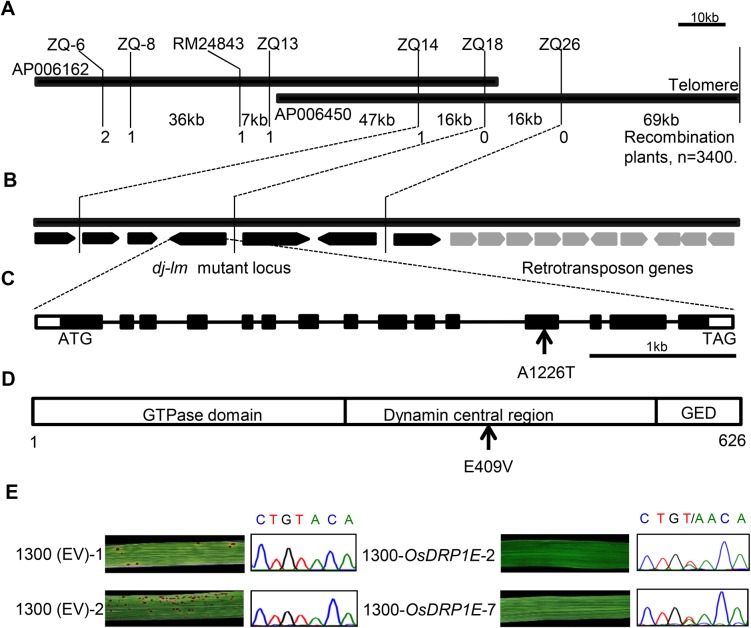
Fig 3. Map-based cloning of OsDRP1E.
(A) Fine physical map of the dj-lm candidate locus. The two thick black bars represent PAC clones AP006162 and AP006450. Words above and below the bars indicate SSR markers, InDel markers and the physical distance between the two markers, respectively. The numbers below the maps represent the number of recombination events. (B) Predicted ORFs in the dj-lm mutant. The thick black bars represent PAC clone AP006450. Arrows indicate the order and orientation of 16 ORFs within the PAC clone AP006450. ORFs in gray are retrotransposon genes. (C) Gene structure of OsDRP1E. The schematic map shows the coding region (black boxes), the 5’ and 3’ untranslated regions (white boxes) and the intron region (lines). Arrow indicates the mutated nucleotide. (D) OsDRP1E protein structure. The three boxes indicate the domains of OsDRP1E. The numbers below the box indicate the size of the protein. Arrow represents the mutated amino acid residue. GED: Dynamin GTPase effector domain. (E) Genetic complementation of OsDRP1E. Left panel: Leaves from transgenic lines (1300 (EV)-1/2) transformed with the pCAMBIA1300 empty vector and their sequencing chromatograms at the OsDRP1E locus. Right panel: Leaves from complemented lines (1300-OsDRP1E-2/7) transformed with the pCAMBIA1300-OsDPR1E construct and their sequencing chromatograms at the OsDRP1E locus.

