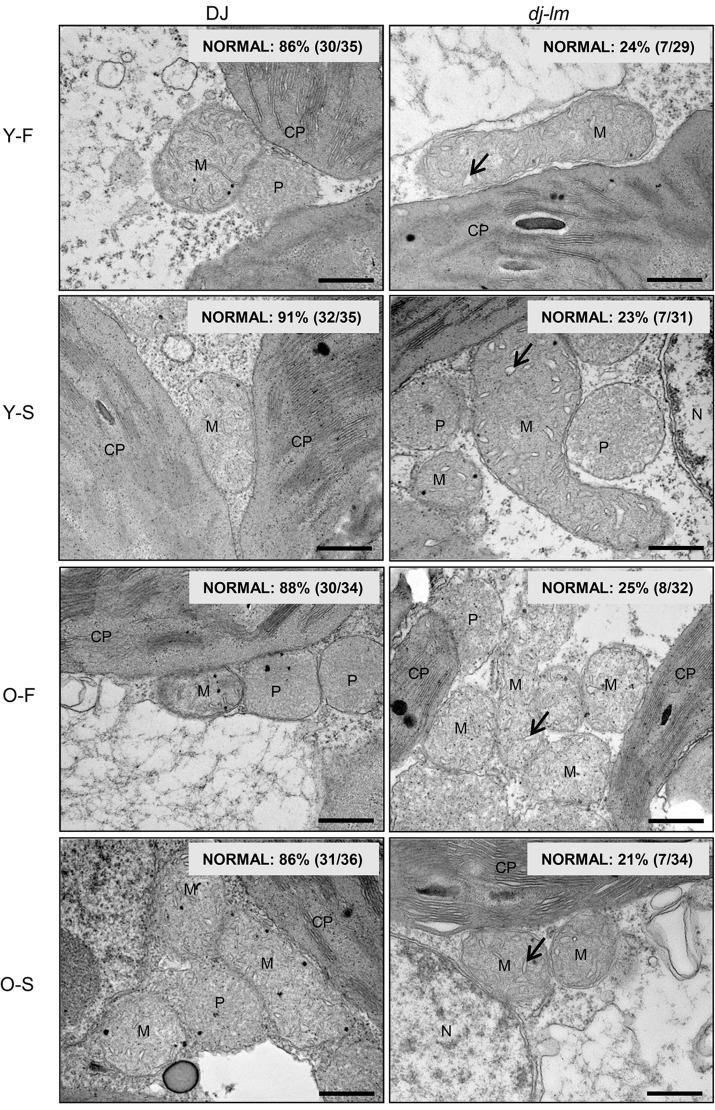
Fig 7. Transmission electron microscopy (TEM) analysis of mitochondrial structure in DJ and dj-lm plants.
Y: Young leaves from four-week-old plants. O: Old leaves from eight-week-old plants. F and S represent the first and the second leaf from the top. Arrow indicates bubble-like cristae. CP, chloroplast; M, mitochondria; N, nucleus; P, peroxisome. Bar = 0.5 μm.

