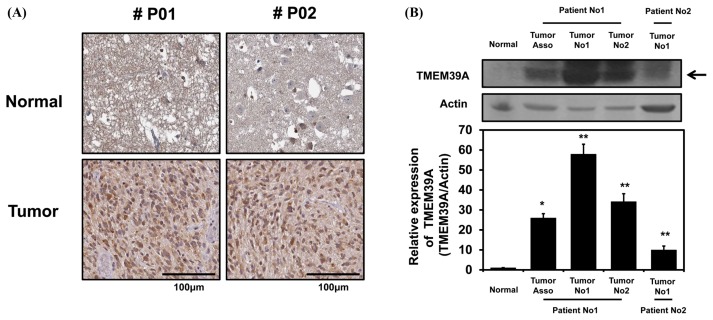
Fig. 4.
TMEM39A expression levels in human brain tumors. (A) Human glioma tissue arrays were immunohistochemically analyzed in terms of TMEM39A staining. Representative images from samples from two patients are shown. Scale bars: 100 μm. (B) Total cell lysates from normal and GBM tissues (tumors no. 1 and 2) from two patients were analyzed in terms of TMEM39A expression (top panel). Tumor-associated normal tissue served as a control (Tumor Asso.). Relative densities were calculated by densitometry. Relative differences in TMEM39A expression levels were determined by normalizing all densitometric values to those of actin (in each lane) and setting the control values to 1 (bottom panel). The results are presented as means ± SDs of data from three independent experiments. *p< 0.05, **p< 0.01.

