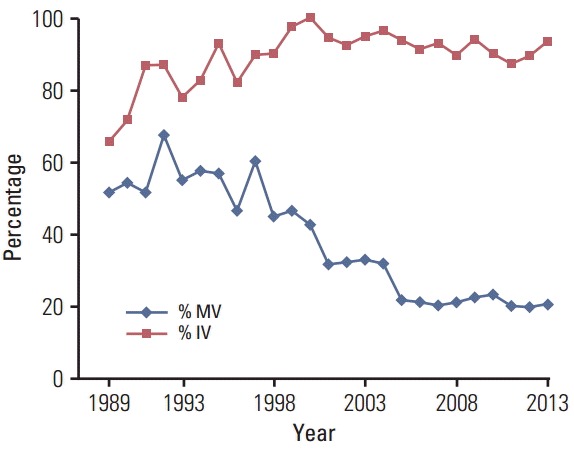
Fig. 2.

The percentage of cases with morphologic verification (% MV; basis of diagnosis code, 5-8) and the percentage of cases with imaging verification (% IV; basis of diagnosis code, 2-8) by calendar year. The pathological diagnosis declined from 1998 to 2005 and then plateaued while the use of imaging in diagnosis of liver and bile duct cancer increased from 1989 through around 2000 and then plateaued at around 90%.
