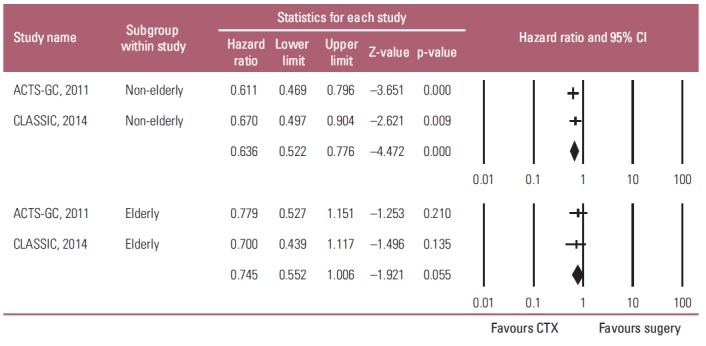
Fig. 3.

Subgroup analysis of the effects of adjuvant chemotherapy (CTX) on overall survival by age: non-elderly (upper graph) versus elderly patients (lower graph). Hazard ratios were analyzed with fixed effects model. Value 0-1 favors adjuvant CTX. CI, confidence interval.
