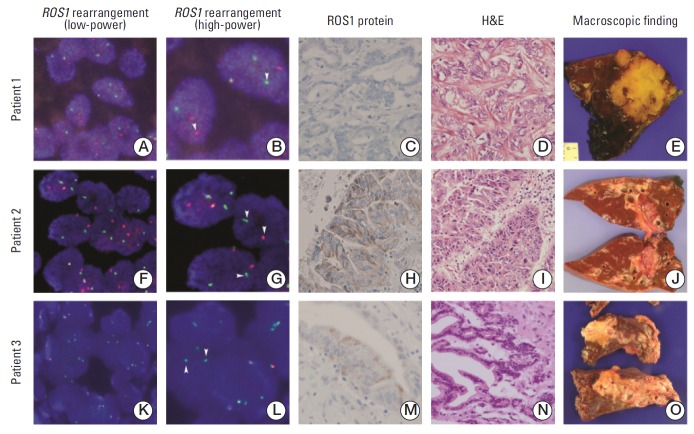
Fig. 1.
Representative ROS1 rearrangement features in cholangiocarcimomas. Fluorescence in situ hybridization (FISH) showing ROS1 rearrangement with break-apart signals in patients 1 and 2 and single green signals in patient 3. FISH showing ROS1 rearrangement with break-apart signals in low-power field (A, F, K) and high-power field (B, G, L). FISH showing ROS1 rearrangement with single green signals (K, L). The arrows indicate ROS1 break-apart or single green signals (A, F, K, ×400; B, G, L, ×630). Immunohistochemical stain for ROS1 in ROS1 rearranged cholangiocarcinoma (C, H, M, ×200). Microscopic features (D, I, N, H&E staining, ×200) and photographs of surgical specimens (E, J, O) are also shown.

