
Figure 3.
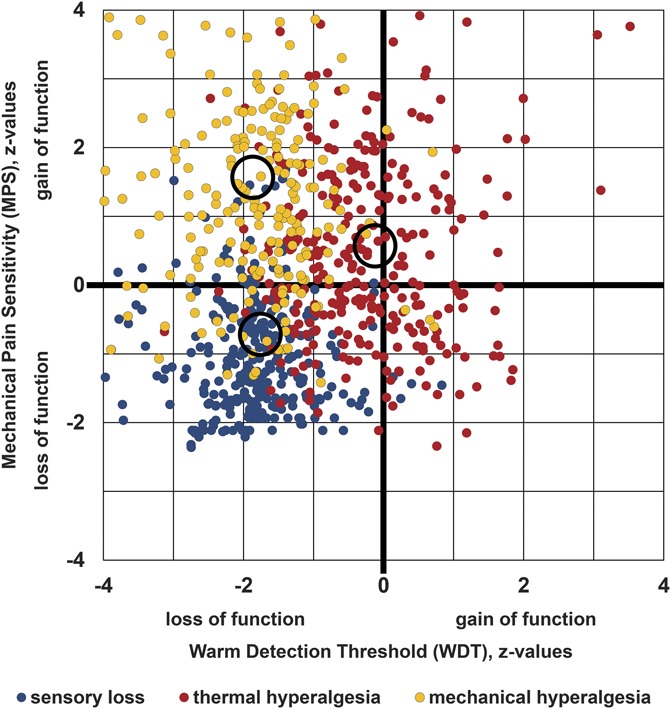
Cluster separation projected onto 2-dimensional space. Scatter plot of the 2 quantitative sensory testing (QST)-parameters that gave the best cluster separation: mechanical pain sensitivity (MPS) plotted against warm detection threshold (WDT). Blue dots: cluster 1 “sensory loss” (n = 381 patients); red dots: cluster 2 “thermal hyperalgesia” (n = 302 patients); yellow dots: cluster 3 “mechanical hyperalgesia” (n = 219 patients). Circles indicate centroids of each cluster.