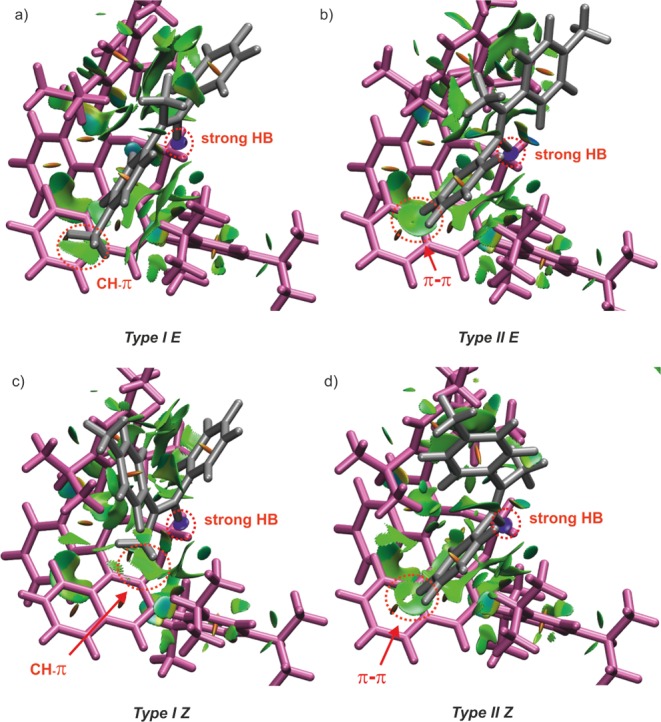
Figure 5.

NCI analysis of the 2a/1c complexes (global minima) showing weak dispersive interactions (green surfaces) and an attractive strong hydrogen bridge between imine and catalyst (blue surfaces). (a) Type I E shows CH−π interaction between the p-methyl substituent of the imine and BINOL of the catalyst. (b) The imine is rotated 180° in Type II E and shows the aniline moiety lies on top of the BINOL aromatic surface and the p-methyl group faces outward from the catalyst. (c) ) In Type I Z, the imine is also rotated and exhibits a CH−π interaction between the α-methyl group and BINOL. (d) Similar to Type II E, Type II Z shows a π−π interaction between the aniline moiety and BINOL, as well as a CH−π interaction between the α-methyl group with the 2,4,6-triisopropylphenyl group of the catalyst; For comparison and clarity, a similar orientation as in Figure 3b was adopted. Isovalue 0.5 and a color range between −3.0 and 3.0 were chosen.
