
Figure 6.
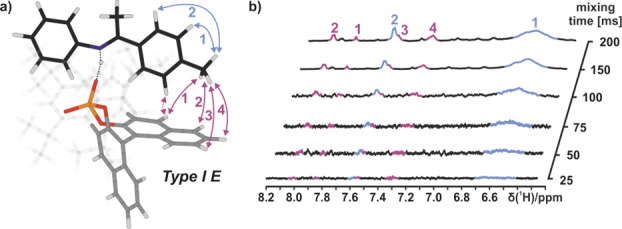
(a) Calculated structure Type I E of E-2a/1c corroborated by inter- (red arrows) and intramolecular NOEs (blue arrows). (b) Corresponding experimental data from 1D selective NOESY spectra at 180 K in CD2Cl2 (see the Supporting Information for additional data).