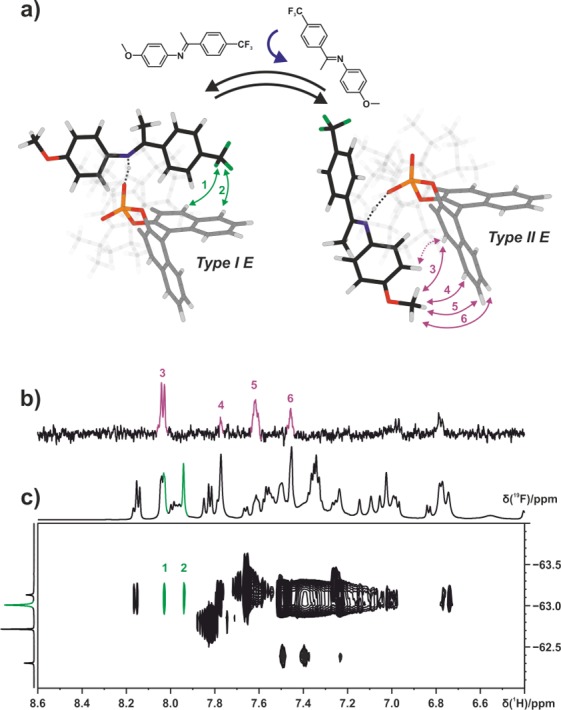
Figure 7.

(a) Tilting of the imine E-3a in relation to the catalyst 1c. The observed NOE pattern (green and purple arrows) reveals the coexistence of complex structures Type I E and Type II E, which are in fast exchange on the NMR time scale at 180 K in CD2Cl2. (b) Section of a 1D selective NOESY of E-3a/1c at 180 K in CD2Cl2 at 600 MHz (excitation on the methoxy group of imine E-3a) showing intermolecular NOEs 3–6 corresponding to structure Type II E. (c) Section of a 1H,19F HOESY spectrum of E-3a/1c at 180 K in CD2Cl2 at 600 MHz showing NOEs 1 and 2 corresponding to structure Type I E.
