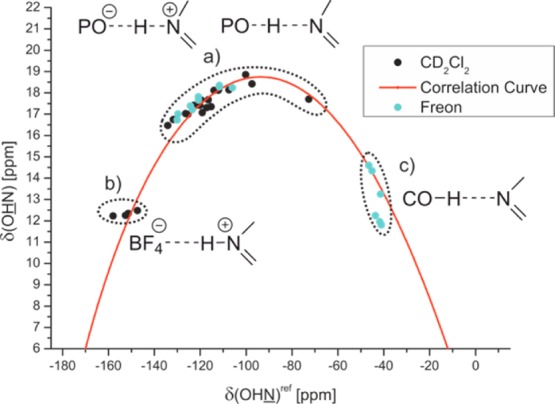
Figure 4.

Plot of δ(OHN)ref against the δ(OHN) of the hydrogen bonded complexes; (a) (R)-TRIP with 2 – 11; (b) HBF4 with 3 and 5; (c) carboxylic acids and phenols with 3 and 5; the 15N chemical shifts of all complexes are referenced to 7 {δ(OHN)ref = δ(OHN) – 340.8 ppm}; spectra corresponding to the different hydrogen bond types are shown in Figure 5; for details see Supporting Information.
