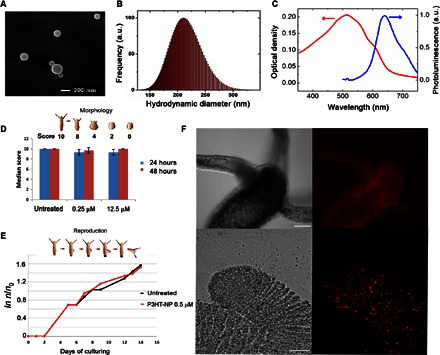
Fig. 1. Characterization of P3HT-NPs and in vivo toxicological analysis.

(A and B) Characterization of P3HT-NPs by scanning electron microscopy and dynamic light scattering (DLS) analysis. (C) Optical absorption (left axis) and photoluminescence spectra (right axis) of P3HT-NPs in an aqueous dispersion. Fluorescence emission excitation wavelength, 470 nm. (D and E) Determination of P3HT-NP toxicity endpoints in H. vulgaris. Numerical scores ranging from 10 (healthy polyp) to 0 (dead polyp) were assigned to progressive morphological changes possibly induced by P3HT-NP treatments, at the indicated doses, and recorded every 24 hours. No significant difference is evidenced between treated and untreated polyps (D). P3HT-NP treatment does not affect the reproduction rate of Hydra. The logarithmic growth curve of a treated Hydra population (red) is fully comparable to the one obtained from a control population (E) (n0 is the number of polyps at time 0, and n is the number of animals recorded at time t). (F) In vivo bright-field (left) and fluorescence (right) imaging of a living polyp treated with P3HT-NPs. Soaking the polyps with 0.25 μM P3HT-NPs causes a fluorescent staining of all tissues. NPs after a few hours appear as fluorescent spots located inside the ectodermal cells. The top images show a head with a crown of tentacles around the mouth. Bottom images show details of the tentacle tip. Scale bars, 200 and 50 μm (top and bottom images, respectively). a.u., arbitrary units.
