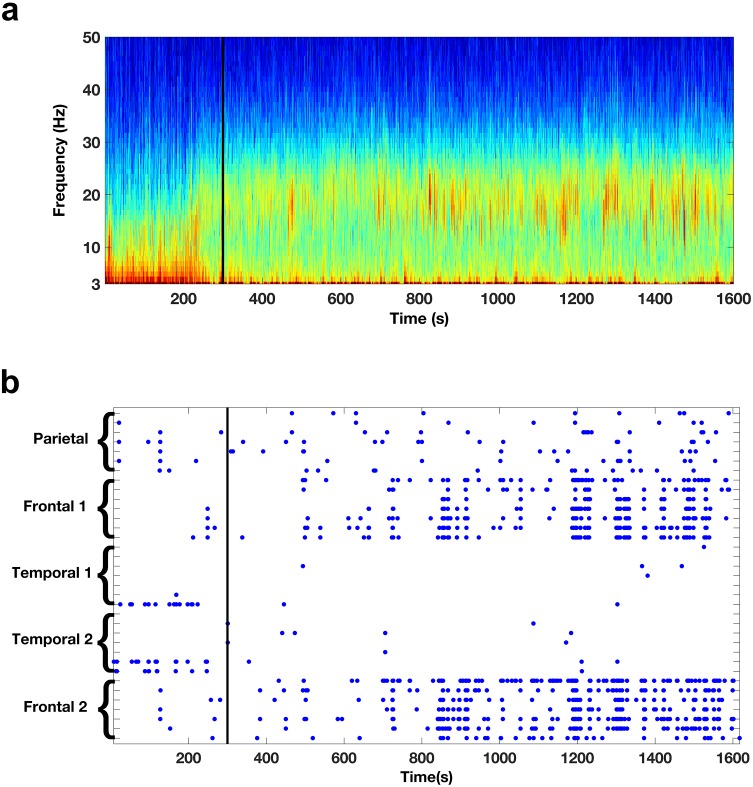
Figure 2. Oscillatory activity across scales.
(a) Spectrogram shows the activity pattern detected from a bipolar derivation of an electrode located in the frontal cortices during REM sleep. The black line indicates the beginning of the REM sleep episode. (b) Pattern of beta activity across all the electrode contacts of one subject. There are two frontal depth electrodes (Frontal 1 and Frontal 2), two temporal depth electrodes (Temporal 1 and Temporal 2), and one parietal depth electrode (Parietal). Each depth electrode has eight contacts. Each row represents activity from one bipolar derivation. Blue dots indicate periods in which beta power in a given contact was 3.0 standard deviations above the median. The black line indicates the beginning of the REM sleep episode.

