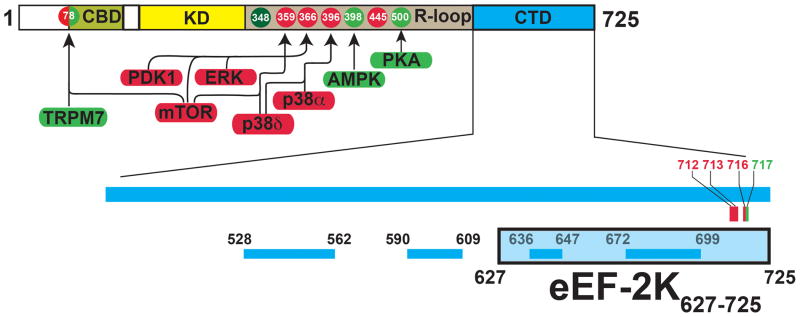
Figure 1.
Schematic representation of the domain structure of eEF-2K. The N-terminal calmodulin-binding domain (CBD), catalytic kinase domain (KD) and the C-terminal domain (CTD) are shown. The region between the KD and CTD is known as the regulatory loop (R-loop) that contains both upregulating (green) and downregulating (red) phosphorylation sites. The kinases that target these phosphorylation sites are indicated. The N-terminal S78 can act as both an activating as well as an inhibitory site. T348, the autophosphorylation of which constitutes a key step in the activation eEF-2K is shown in dark green. The specific C-terminal mutations, discussed in the text that either reduce (red) or enhance (green) eEF-2 phosphorylation, are indicated. The lower panel shows the location of the PFAM-predicted SEL-1 like repeats (SLRs). The eEF-2K627-725 construct (shaded light blue) includes the last two predicted SLRs.

