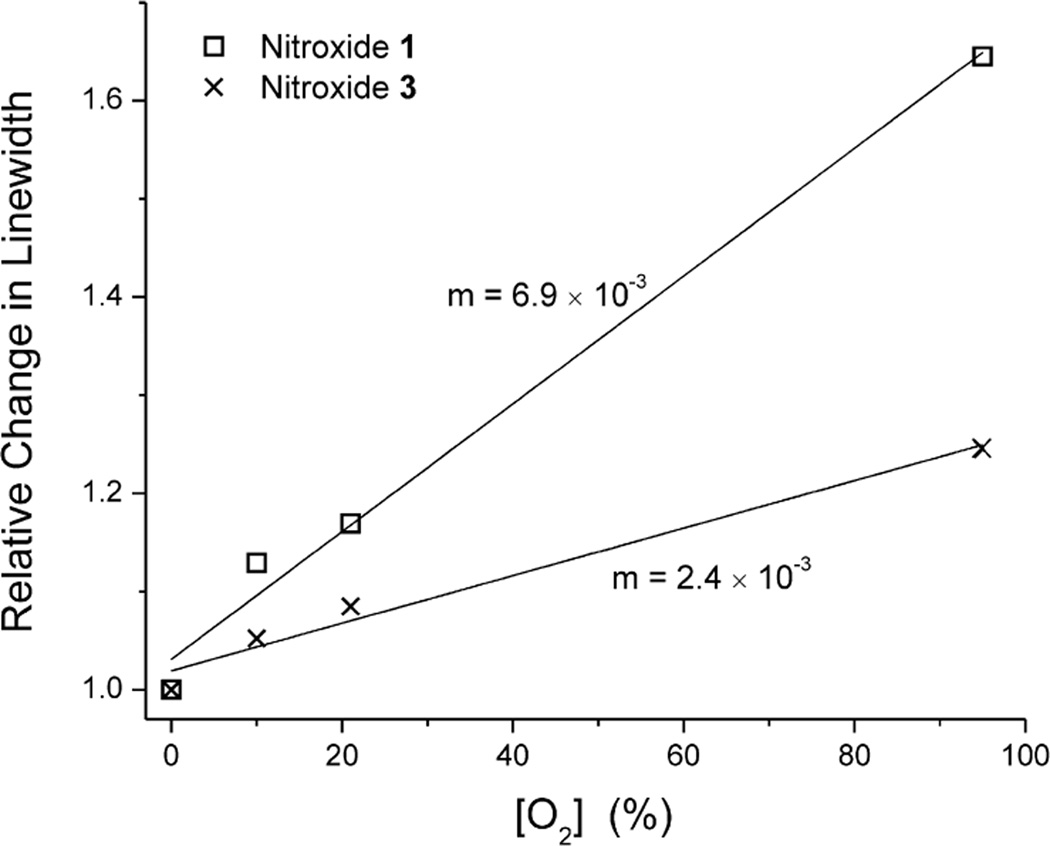
Fig. 3.
Relative changes in linewidth of nitroxides 1 and 3 in aqueous solution equilibrated with different concentrations of O2 (0, 10, 21 or 95%) at 1 GHz. Solid lines are least-squares fits of the data; the slope of each line is indicated on the graph. Where not shown, error bars are smaller than the symbols (n = 5).

