
Figure 5. TMPD-injected Tlr9−/− mice produce autoantibodies specific for RNA-associated autoantigens.
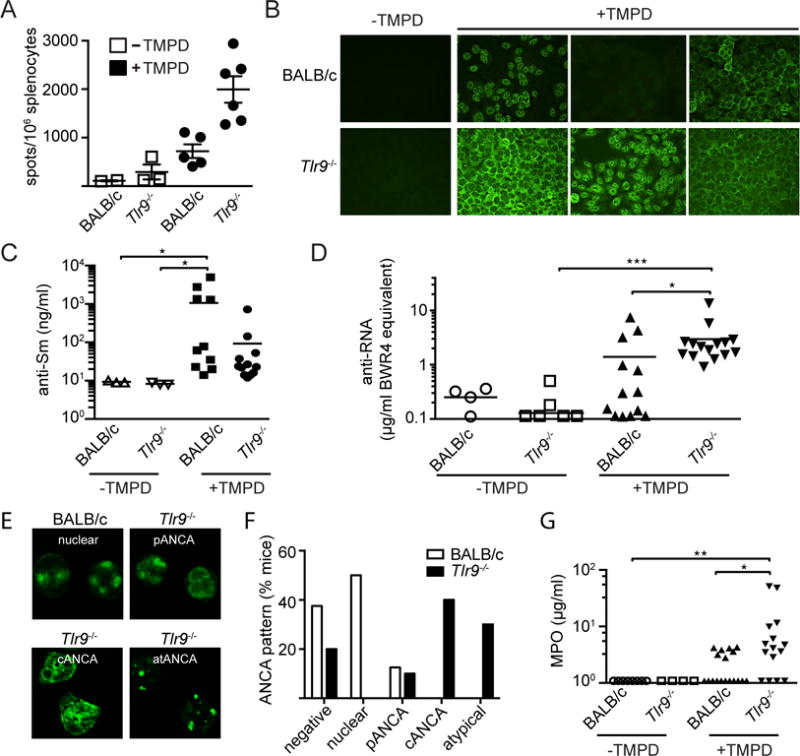
(A) Spleens were harvested from non-treated versus TMPD-treated WT or Tlr9−/− mice 5 month post injection and the number of IgG2a+ AFCs was measured by ELISPOT as described (21). (B) Representative images of HEp2 ANA staining patterns from untreated and TMPD-treated BALB/c WT and Tlr9−/− mice (BALB/c WT n=11; Tlr9−/− n=14; BALB/c WT TMPD n=37; Tlr9−/− TMPD n=37). (C) Serum anti-Sm titers from untreated and TMPD-treated BALB/c WT and Tlr9−/− mice 5 month post TMPD treatment. (D) Anti-RNA autoantibody levels in sera from untreated and TMPD-treated BALB/c WT and Tlr9−/− mice 5 month post TMPD treatment were determined by ELISA. (E) Representative images of ANCA staining patterns of sera obtained from TMPD-treated BALB/c WT and Tlr9−/− mice; and (F) quantification based on ANCA quality as indicated. (G) MPO autoantibody titers from untreated and TMPD-treated BALB/c WT and Tlr9−/− mice 5 month post TMPD treatment (BALB/c WT n=8; Tlr9−/− n=4; BALB/c WT TMPD n=18; Tlr9−/− TMPD n=16). Throughout this figure each shape corresponds to an experimental female mouse. Statistics were done using the non-parametric Kruskal-Wallis test.