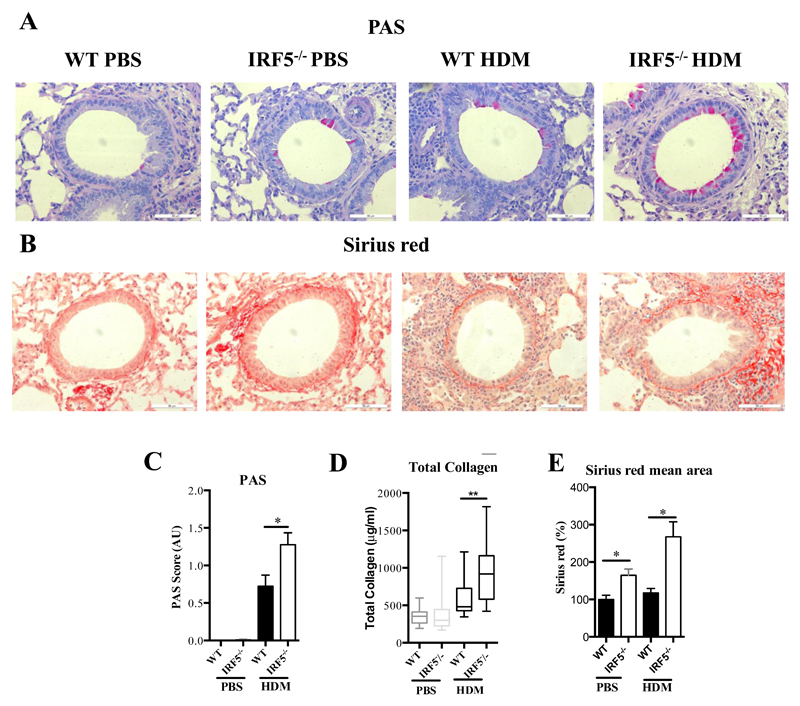
Figure 2. IRF5 deficiency leads to augmented mucus and collagen production in the lung after HDM exposure.
Lung sections stained with PAS (A) and Sirius red (B), respectively. PAS staining to identify mucin-containing cells (purple, top panel); Sirius Red staining of lung sections depicts peri-bronchiolar and perivascular collagen (red, bottom panel), original magnification x40; Scale bar = 50 μm, representative photomicrographs are shown. (C) Scoring of lung sections stained with periodic acid-Schiff. (D) Recently synthesized total lung collagen was quantified by a biochemical (Sircol) assay. (E) Quantitative image analysis of sub-epithelial peri-bronchiolar collagen density determined by measuring Sirius red-stained collagen in lung sections under polarized light; data was normalized to WT untreated control and expressed as percent (%) increase. Data shown represent means ± standard error mean (s.e.m.), *P < 0.05, **P < 0.01, WT compared with IRF5-/- animals by Mann-Whitney test. Box and whisker plots represent the mean, IQR and minimum and maximum values. Data were generated from four independent experiments; n=15–20 per group.

