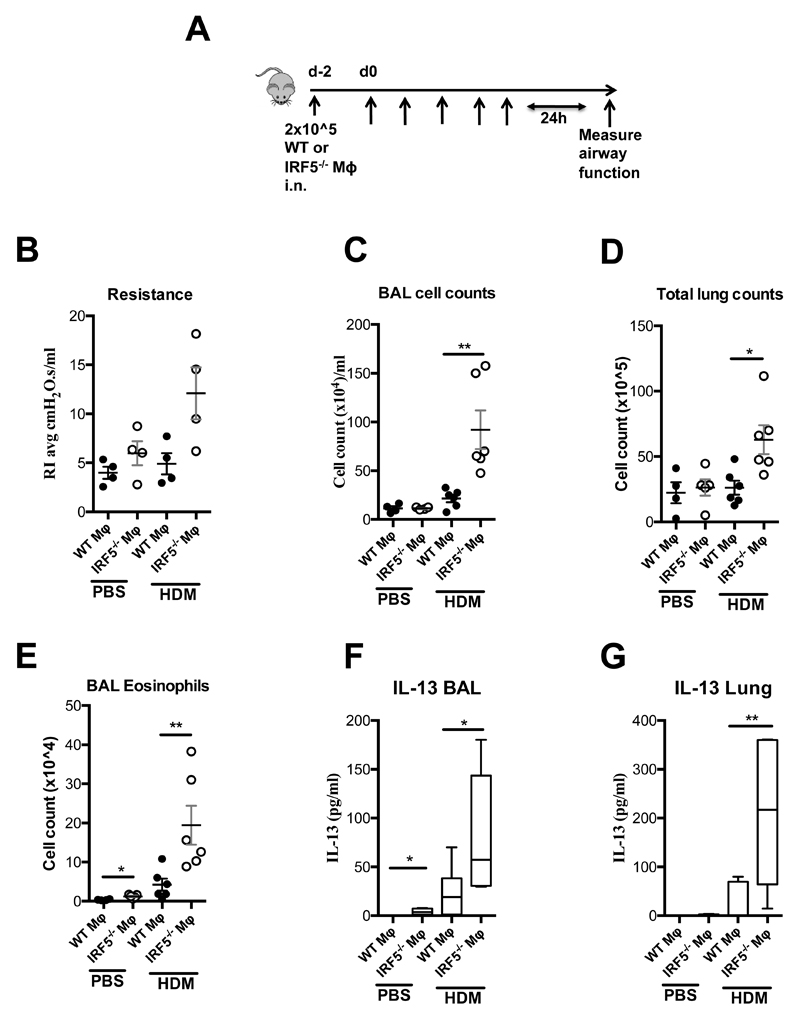
Figure 4. IRF5-expressing AMs control responses to inhaled aeroallegen.
A) Schematic for adoptive transfer model. (B) Resistance measured in tracheotomised animals at a 300 mg/ml dose of methacholine. Total counts of cells recovered from the BAL (C) and lung (D). Total numbers of eosinophils recovered from the BAL (E) and IL-13 producing innate lymphoid cells recovered from the lung (F). BAL (G) and lung (H) IL-13 levels as determined by ELISA. Data shown represent mean ± s.e.m. *P < 0.05, WT compared with IRF5-/- animals by Mann-Whitney test. Box and whisker plots represent the mean, IQR and minimum and maximum values; n=4-6 per group.

