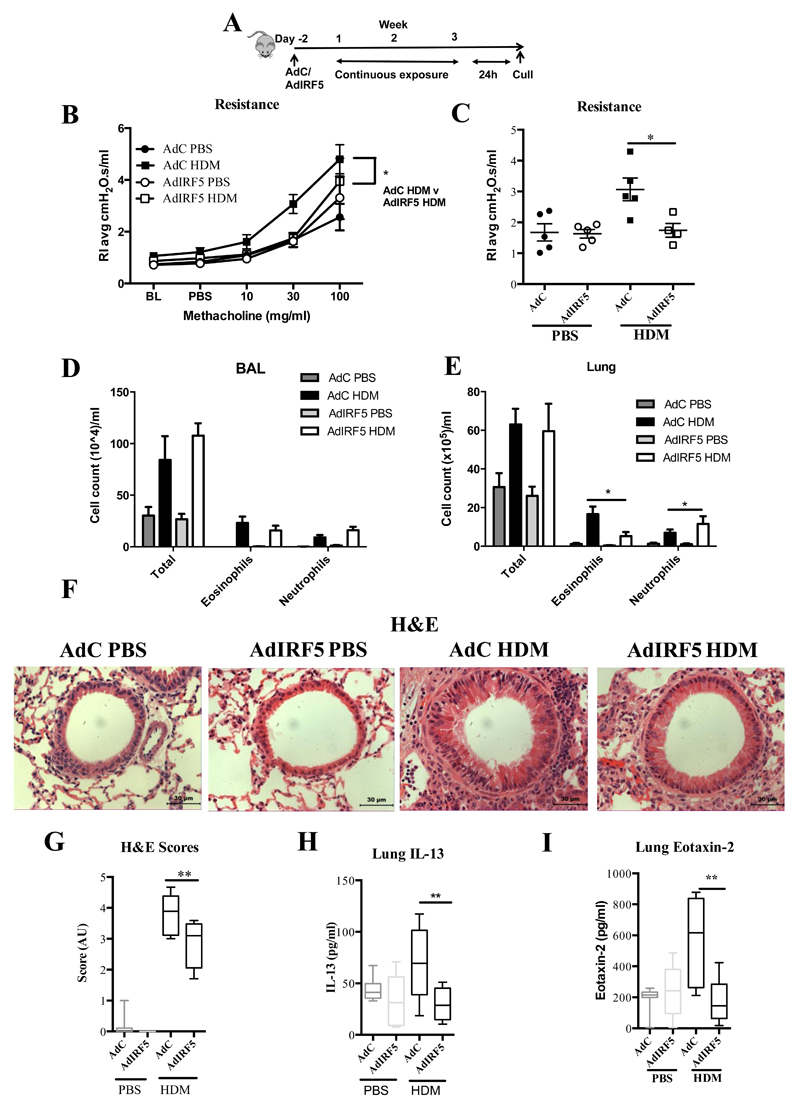
Figure 5. Overexpression of IRF5 ameliorates house dust mite-mediated airway hyper-responsiveness and inflammation.
(A) Experimental design of HDM-induced allergic airways disease. Resistance measured in tracheotomised animals to a dose response (B) or at a representative dose of 30 mg/ml of methacholine (C); n=4-5 per group. Differential cell counts of Wright-Giemsa stained cytospins recovered from the BAL (D) and lung (E); n=4-5 per group. (F) Lung sections stained with H&E; original magnification x40; Scale bar = 50 μm, representative photomicrographs are shown. (G) Semi-quantitative scoring of H&E (i) sections. Lung IL-13 (H) and eotaxin-2 (I) levels and as determined by ELISA. Data shown represent means ± standard error mean (s.e.m.), *P < 0.05, **P < 0.01, WT compared with IRF5-/- animals by Mann-Whitney test. Box and whisker plots represent the mean, IQR and minimum and maximum values. Data were generated from three independent experiments; n=10-15 per group.

