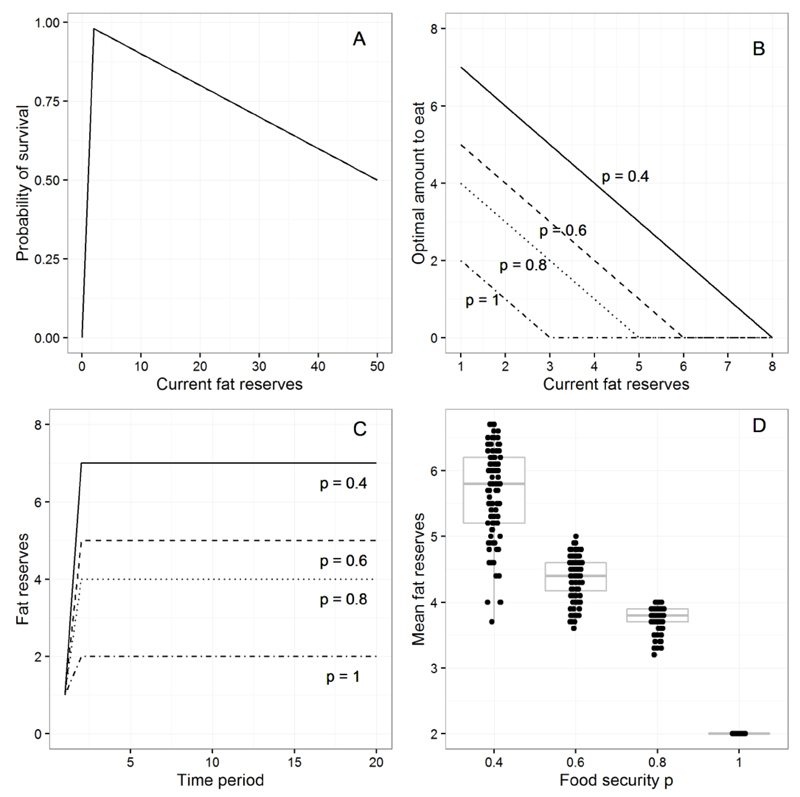
Figure 1.
Output from the model described in section 3 (for details, see Online Appendix A). A. The assumed probability of survival against current level of fat reserves. B. The optimal amount to eat for different levels of fat reserves and four values of the food security parameter p. C. Fat reserves over 20 time periods for individuals who begin with reserves of 1 unit, follow the optimal eating policy for their level of food security, and find food in every period. D. Mean fat reserves over 40 time periods for simulated individuals who find food each period with probability p and follow the optimal eating policy for their level of food security. Points have been jittered in the horizontal dimension to make them more visible.

