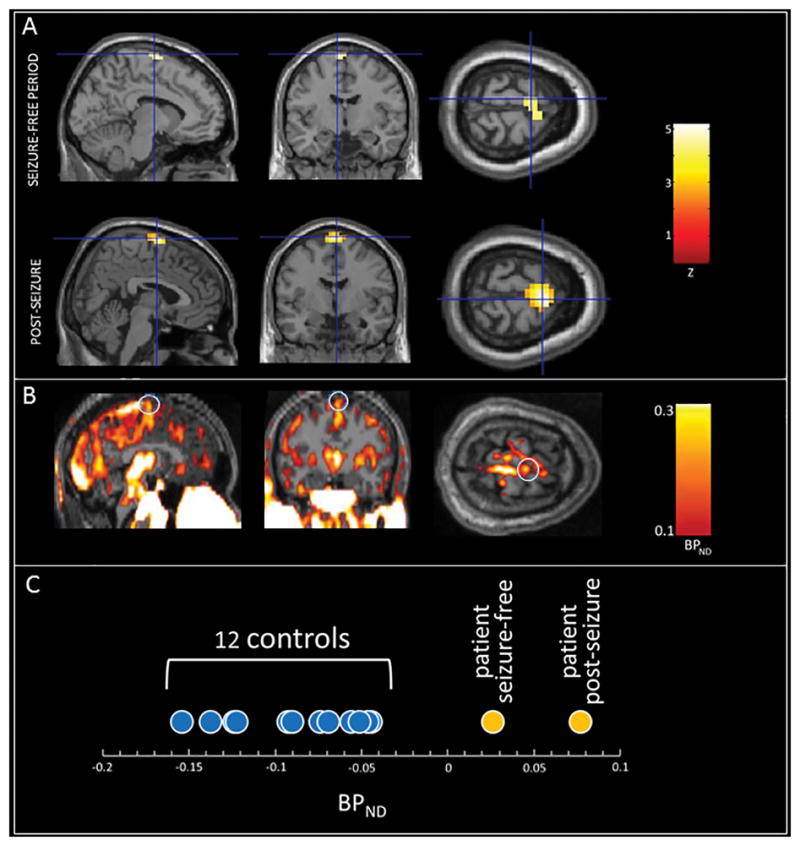
Figure 1.

Abnormally increased neuroinflammation (TSPO expression by activated microglial) as assessed using [11C]PK11195 PET in a patient with clinically-defined frontal lobe epilepsy. A: Z-maps (the patient’s PET images statistically compared to 12 age-matched controls) obtained during a seizure-free period (top) and ~36 hours after a typical seizure (bottom.) Note the nearly identical location of abnormally increased TSPO expression in the midline SMA region in both scans, with greater intensity and spatial extent in the post-seizure scan. Crosshairs are at the voxel of peak intensity in each scan. Images are thresholded at Z=2.5 and overlaid onto a template T1 MRI. B: The patient's post-seizure BPND image, reflecting TSPO expression, overlaid on his native T1 MRI, without statistical comparison to controls. Note radiotracer uptake in the region identified in the post-seizure Z-map (white circles) as well as in multiple other cortical and subcortical regions including thalamus, brainstem, posterior superior sagittal sinus and extracranial tissues, all of which are also present in controls, making focally abnormal uptake more difficult to appreciate on visual inspection. C: Average BPND for each subject within the region of abnormality (bilateral SMA) identified in the comparison between the patient’s post-seizure image and the group of controls. Note significantly higher BPND in the patient’s two scan as compared to the twelve controls.
