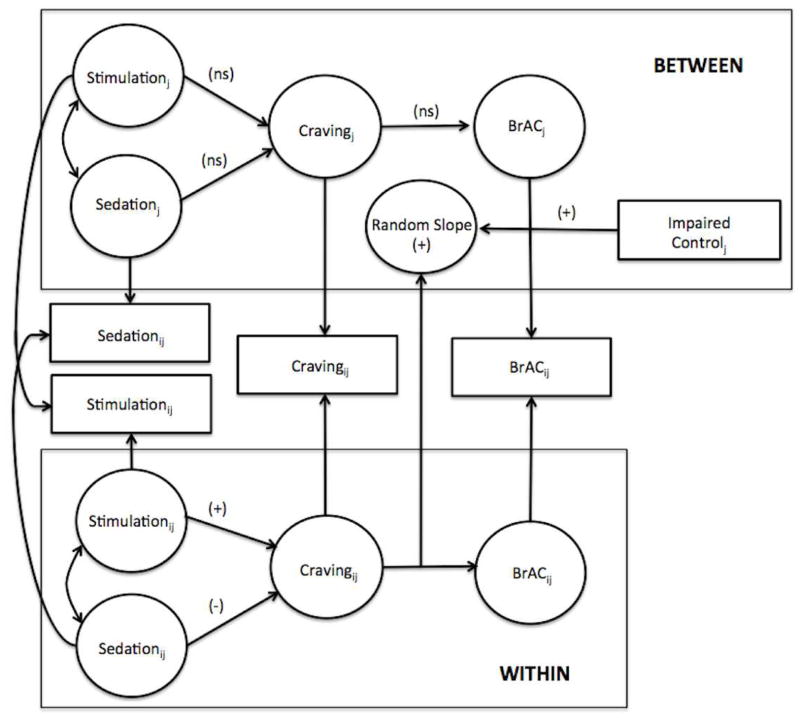
Figure 1.
Conceptual diagram of the multilevel structural equation model (MSEM) showing hypothesized associations at each level of analysis. The center panel represents the observed variables, with observations at each of the four time points (i) for every participant (j). Each (i) measurement of BrAC is lagged approximately 15 minutes from the corresponding measurement of subjective response and craving. The top panel shows the between-person component of the model and the bottom panel shows the within-person component. Symbols in parentheses above path arrows denote whether the path is hypothesized to be positive (+), negative (−), or non significant (ns). As shown, we hypothesized that the associations among stimulation, sedation, craving and BrAC would be significant at the within-person level but not at the between person level. Random intercepts for all within-person associations are estimated but are not depicted in the figure for simplicity. A random slopes for the within-person association between craving and BrAC was estimated, as variance in this slope was hypothesized to be associated with individual differences in impaired control over alcohol (i.e., moderated by impaired control). This random slope factor is shown on the between-person level as the value of the slope varies across participants. BrAC= Breath alcohol content.

