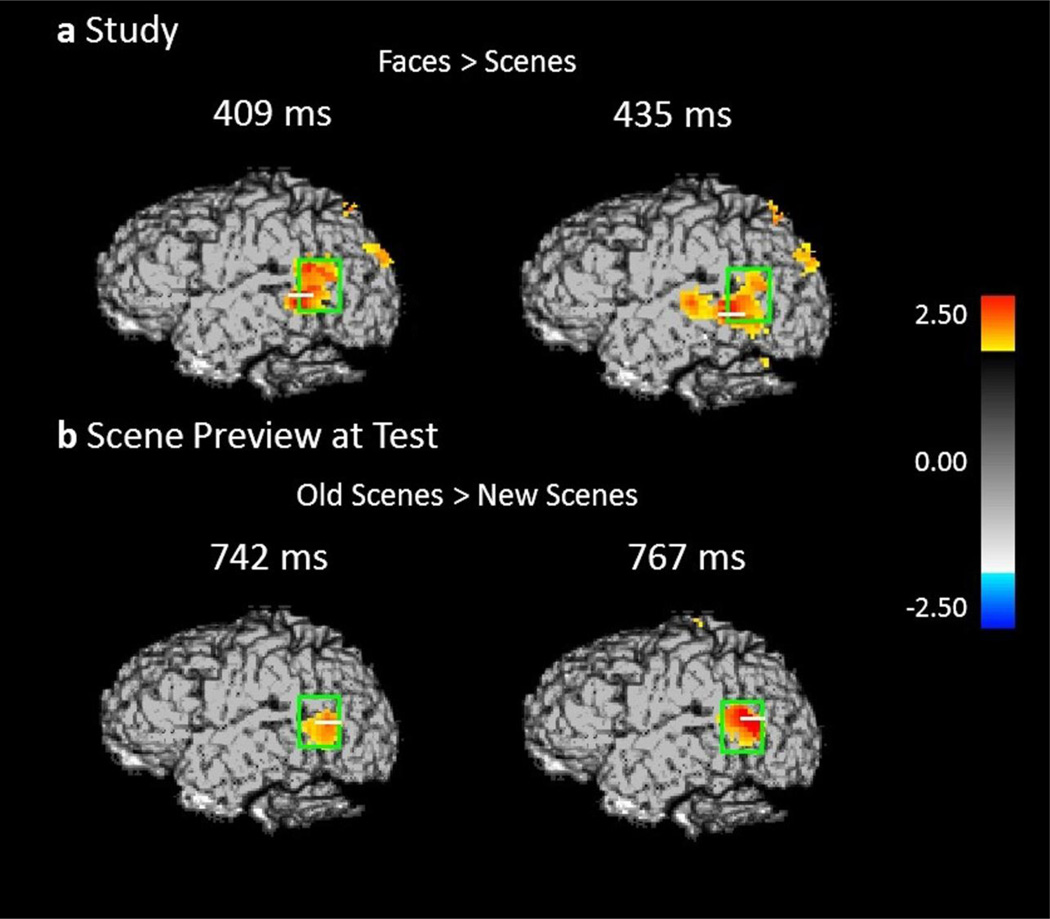
Figure 3.
Spatial maps based on group level Z-statistics of the EROS data projected on sagittal brain surfaces (left hemisphere view). Dark gray shading represents the brain area sampled by the recording montage. The light green rectangle indicates the STS ROI. (a) Activity during study trials for face-first trials versus scene-first trials in the left STS at 409 ms and 435 ms. (b) Activity during the scene preview for previously studied scenes versus completely novel scenes in the left STS at 742 ms and 767 ms.

