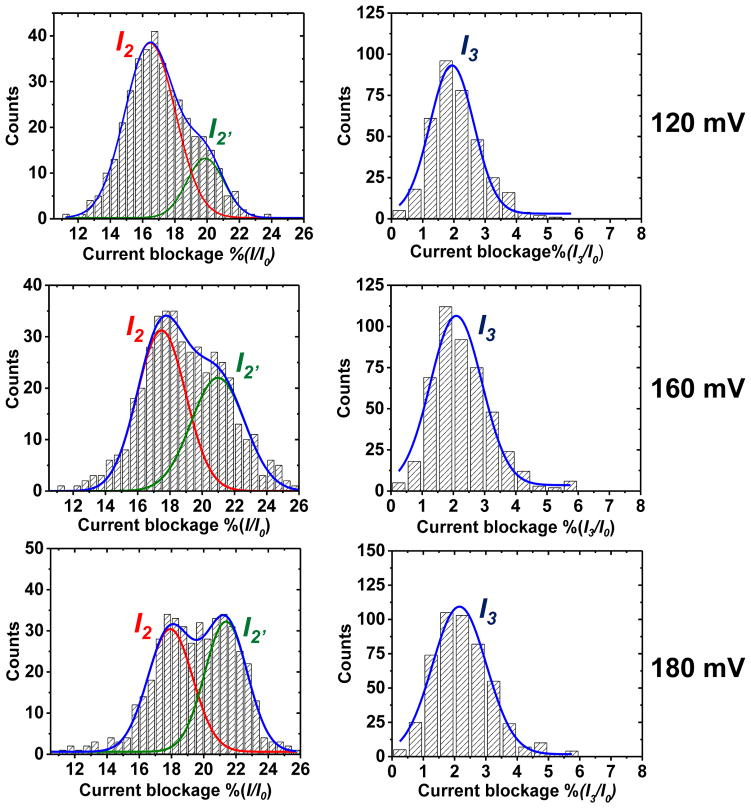
Figure 4.
Current histograms for the step-current levels monitored for the 41-mer BPDE events. (A) Plots of frequency distributions for the I2 and I2′ current levels. (B) Plots of frequency distributions for the I3 current levels. The data were collected at 120, 160 and 180 mV (trans vs. cis) in 1 M KCl at 25.0 ± 0.5°C and plotted with a bin size of 0.5 pA. Population distributions represent 400–450 events.

