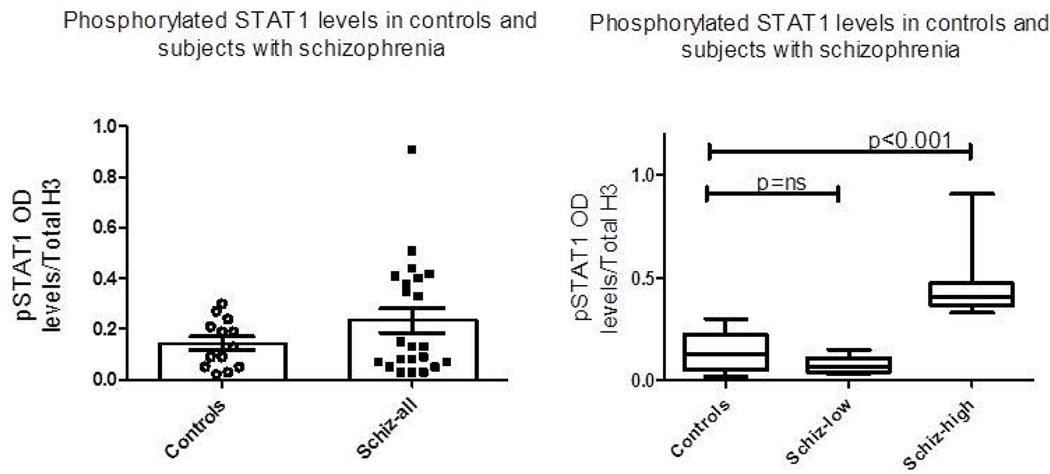
Figure 1.
(a) Scatterbar plot of control and all schizophrenia subjects on measures of pSTAT1 normalized to Total H3 protein from nuclear extracts in PBMCs. No significant difference (p<0.09) between control group and all participants with schizophrenia group. (b) Schizophrenia participants divided along a significant bimodal distribution as noted in results into SZ-LOW pSTAT1 and SZ-HIGH pSTAT1 groups. Box-whisker plots demonstrating median of the three groups. Significant differences as indicated. No difference between CON-LOW pSTAT1 vs SZ-LOW pSTAT1 groups.

