
Figure 1.
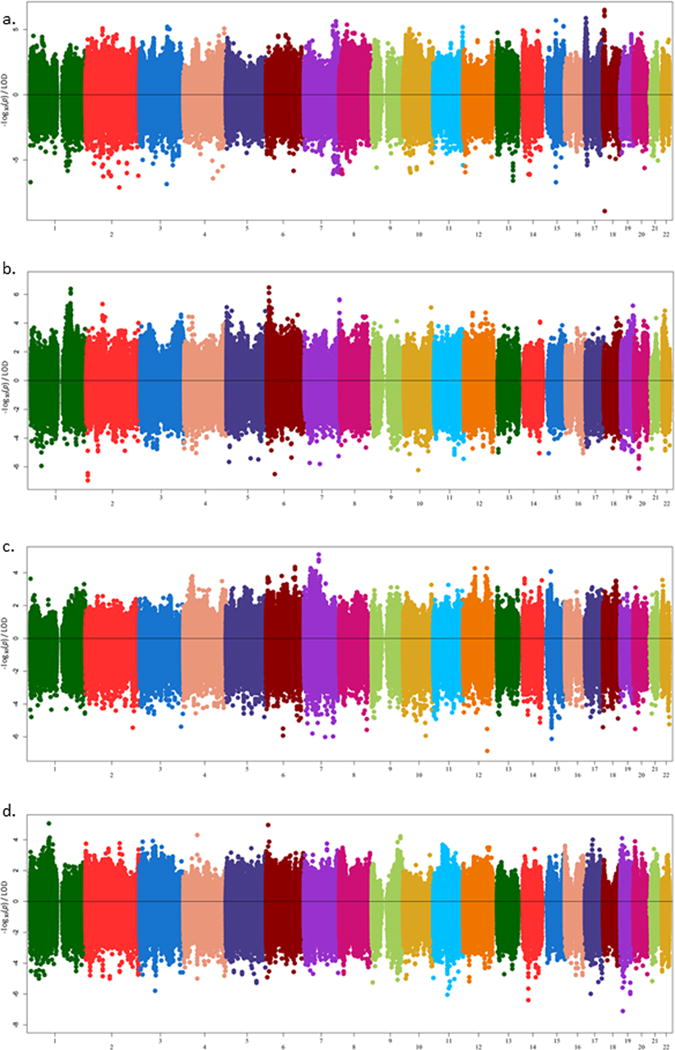
Opposed plots showing LOD scores from the two-point linkage (upper portion) and log-transformed p-values for association (lower portion) results across all arrays for (a.) TNFα receptor 2 levels, (b.) Acute Insulin Response (AIR). (Note the broad linkage peak on Chromosome 1, and the strong linkage also on Chromosome 6), (c.) Insulin Sensitivity Index (SI) (Of particular note are the signals on chromosomes 7 and 12.), and (d.) Low Density Lipoprotein (LDL) levels. (Note the signals on chromosome 4, contributed by LPHN3 and chromosome 19, which represents the APOE locus, evaluated in our previous publication with Apolipoprotein B levels.)