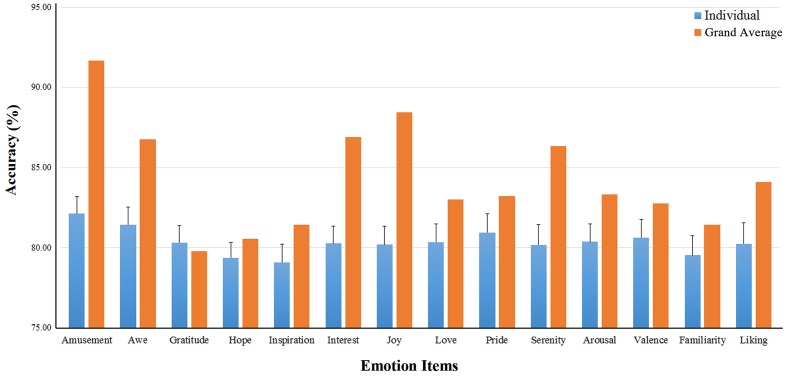
FIGURE 5.
Binary classification accuracies on the ten positive emotion experience. The binary classification accuracies on the 14 emotional experience items. The blue bars show the individual-based accuracies and their standard deviations (the error bars); The yellow bars are the accuracies using the grand-average based features.

