
Figure 3.
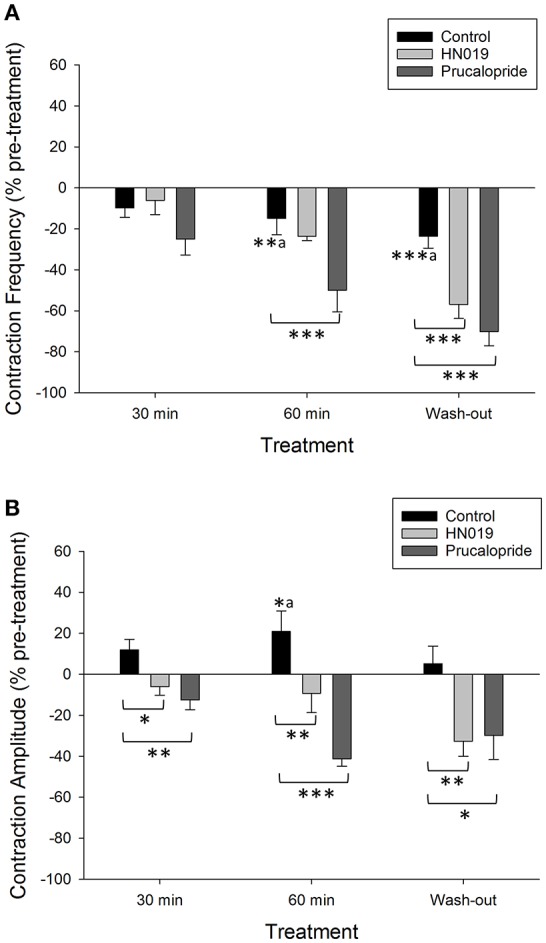
Summary graphs of treatment effects on non-synchronous motility parameters in the isolated large intestine. Data are shown as percent change from the pre-treatment control for: Krebs buffer treatment control (black) (n = 8), prucalopride (dark gray) (n = 10), and HN019 extract (10%) (light gray) (n = 8). Non-synchronous contraction (A) frequency and (B) amplitude, were measured during a 30 min control recording and compared with that over 0–30 and 30–60 min of exposure to treatments, and following 60 min of washout. Amplitude was measured in the proximal colon. Statistical significance was determined using repeated measures ANOVA and treatment compared with either Krebs buffer treatment control or the pre-treatment control (a shown only for Krebs). Asterisks indicate statistical significance (*p < 0.05; **p < 0.01; ***p < 0.001). Data show mean ± SEM.