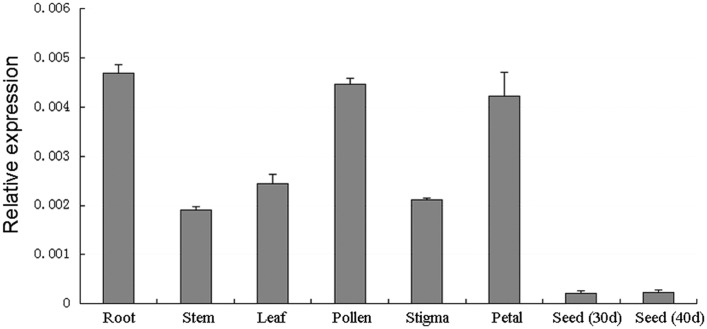
FIGURE 3.
Expression patterns of BnSIP1-1 in different tissues in B. napus using QPCR analysis. The y-axis represents the relative fold difference in mRNA level and was calculated using the ΔΔCt method with BnACTIN as the internal control. The vertical bars indicate ± SD of four replicates on one sample. Three biological experiments were performed, which produced similar results.

