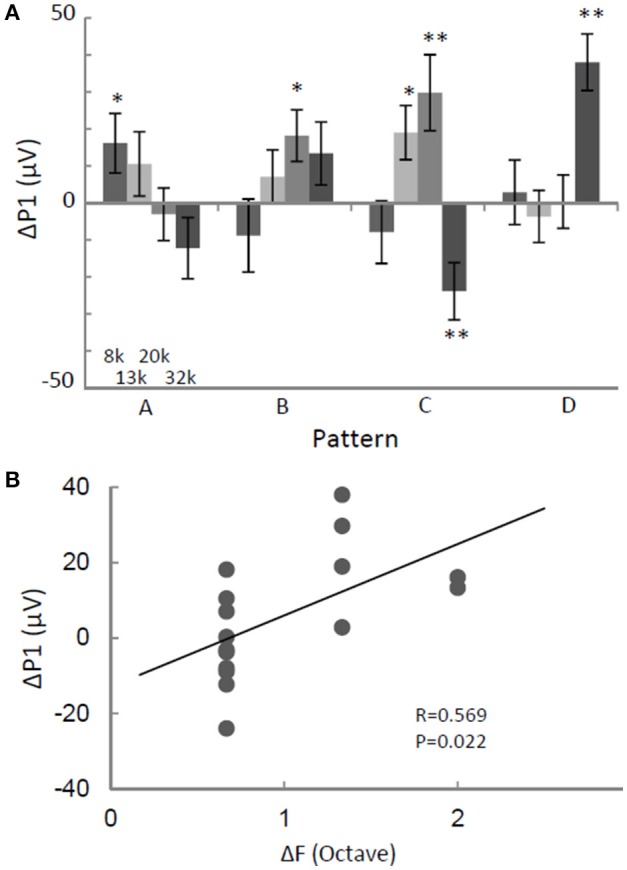
Figure 4.

ΔP1 depends on the test stimulus. (A) ΔP1 as a function of sequence pattern. P1 in response to an identical tone depended on the sequence patterns. (B) ΔP1 as a function of frequency separation with respect to the preceding tone. ΔP1 of the largest P1 in the activation map was quantified for the presented tone. Two-sided t-test, *p < 0.05; **p < 0.01. Error bars show ±s.e.m.
