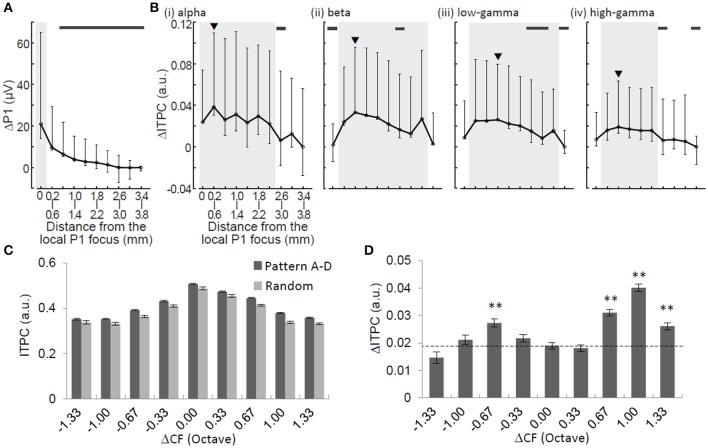
Figure 6.
Spatial characterizations of ΔP1 and ΔITPC. ΔP1 (A) and ΔITPC (B) as functions of physical distance from the P1 local focus. Median and error bars indicating 25 and 75% quartile deviations are provided. Black arrowheads in (B) indicate the local maxima of ΔITPC. Shaded areas indicate the ranges of half-widths in relation to the local maxima. Thick horizontal bars indicate that ΔP1 or ΔITPC at a given distance are significantly smaller than the local maxima (Mann-Whitney U-test with Bonferroni correction, p < 0.05). ITPC (C) and ΔITPC (D) in the low-gamma band as a function of tonotopic distance (ΔCF in octave). Two-sided t-test, **p < 0.01.

