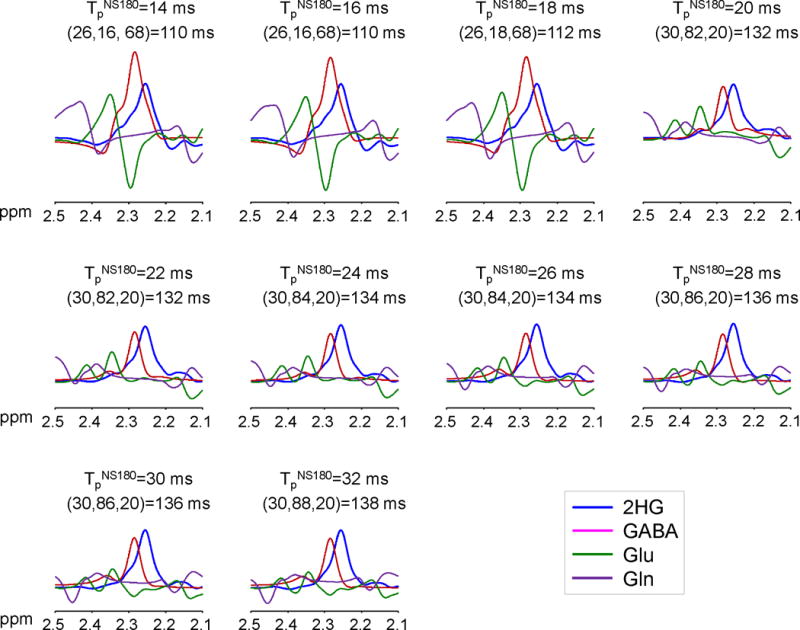
Figure 3.

Numerically calculated spectra of 2HG, GABA, Glu and Gln at equal concetrations for each of TpNS180 = 14 – 32 ms with 2 ms increments. The subecho time set (TE1, TE2, TE3), shown together with TE at the top in each figure, was chosen at which the 2HG 2.25-ppm peak amplitude was maximum for each TpNS180. Spectra were broadened to singlet linewidth of 5 Hz. Shown at the top of each figure are TpNS180, (TE1, TE2, TE3), and TE.
