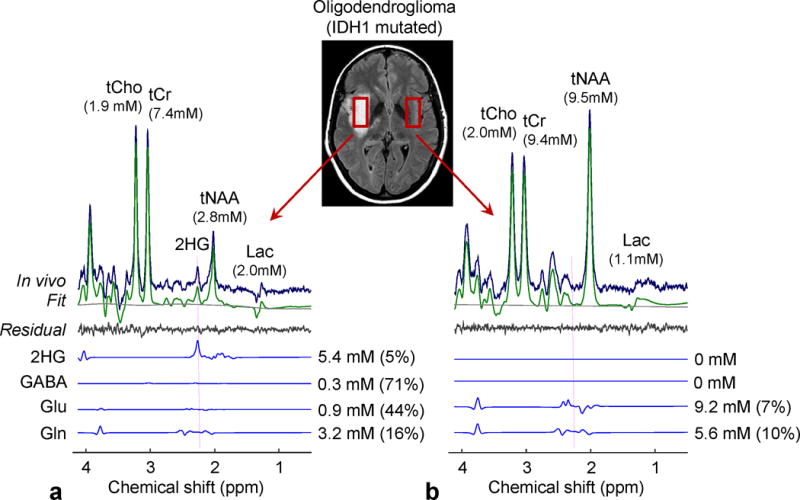
Figure 6.

In-vivo spectra from an IDH1-mutated oligodendroglioma (a) and the contralateral voxel (b), obtained with the 2HG-optimized triple-refocusing sequence, are shown together with LCModel outputs and spectra of 2HG, GABA, Glu and Gln. The estimated concentrations of the metabolites are presented with percentage CRLB values. Vertical dotted lines were drawn at 2.25 ppm. The voxel size and scan time were identical between the scans (3.2×1.5×1.2 cm3 and 12.8 min). Spectra were normalized to STEAM TE=13 ms water. The metabolite concentrations in the contralateral were estimated with reference to water at 40 M following the correction for relaxation effects using T2 = 150, 240, 290 and 180 ms for tCr, tCho, tNAA, and other metabolites, respectively (21,22), and T1 values used for tumor data correction.
