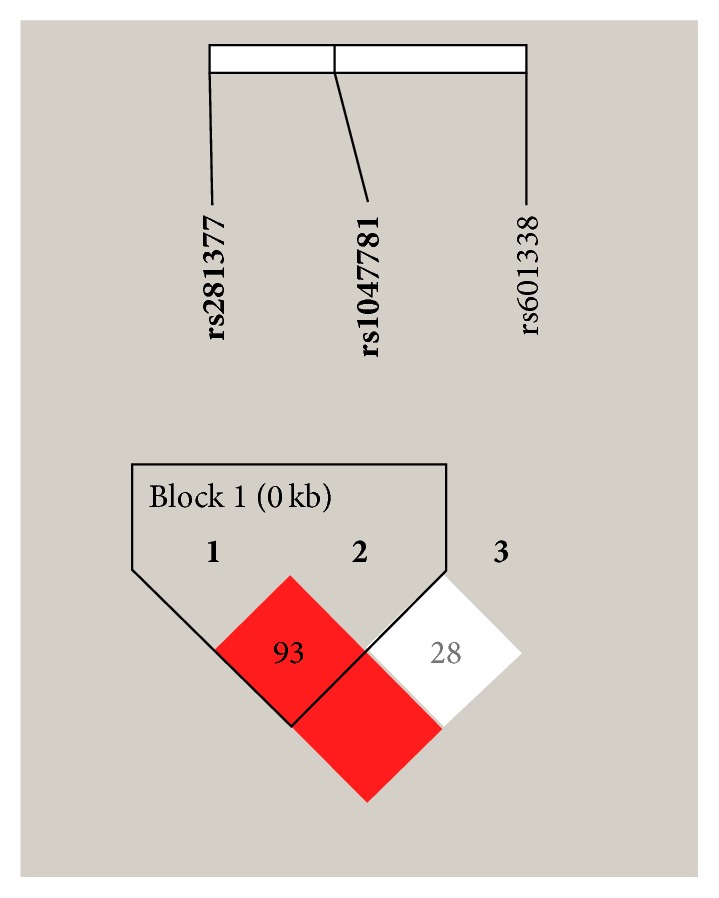
Figure 1.

The linkage disequilibrium patterns of FUT2 gene in Han population from Southeast China. The number in a square represents D′ value for each of the two single-nucleotide polymorphisms (SNPs). Dark color of a square indicates that there is a strong connection between the two SNPs.
