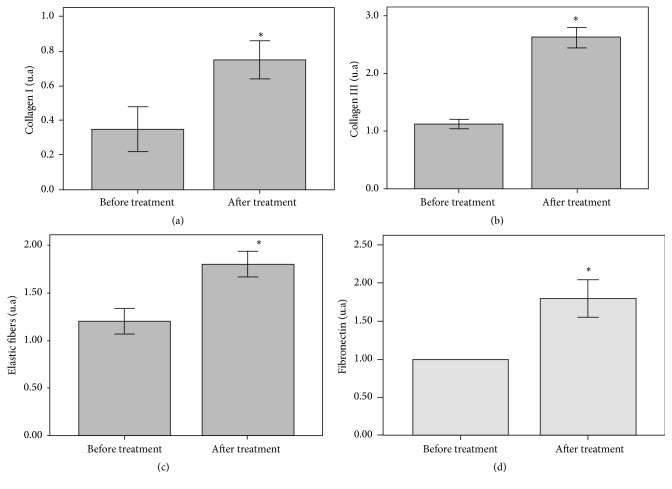
Figure 5.
Semiquantitative analysis of immunohistochemistry images of collagens I (a) and III (b), elastin (c), and fibronectin (d) before and after the cosmetic treatment, showing increases of 50.0%, 100.0%, 116.6%, and 80.0%, respectively, in the levels of each ECM component at the end of the treatment compared to baseline (∗p ≤ 0.05).

