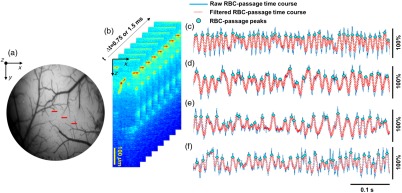
Fig. 1.
(a) The picture displays a typical cranial window showing the vasculature of the cortical surface. The red lines indicate where repeated B-scans were performed to obtain the RBC-passage time courses. (b) Interlaced B-scan images illustrate the repetitive RBC-passage B-scan. (c)–(f) Representative RBC-passage time courses (0.5 s) of four different capillaries are presented.

