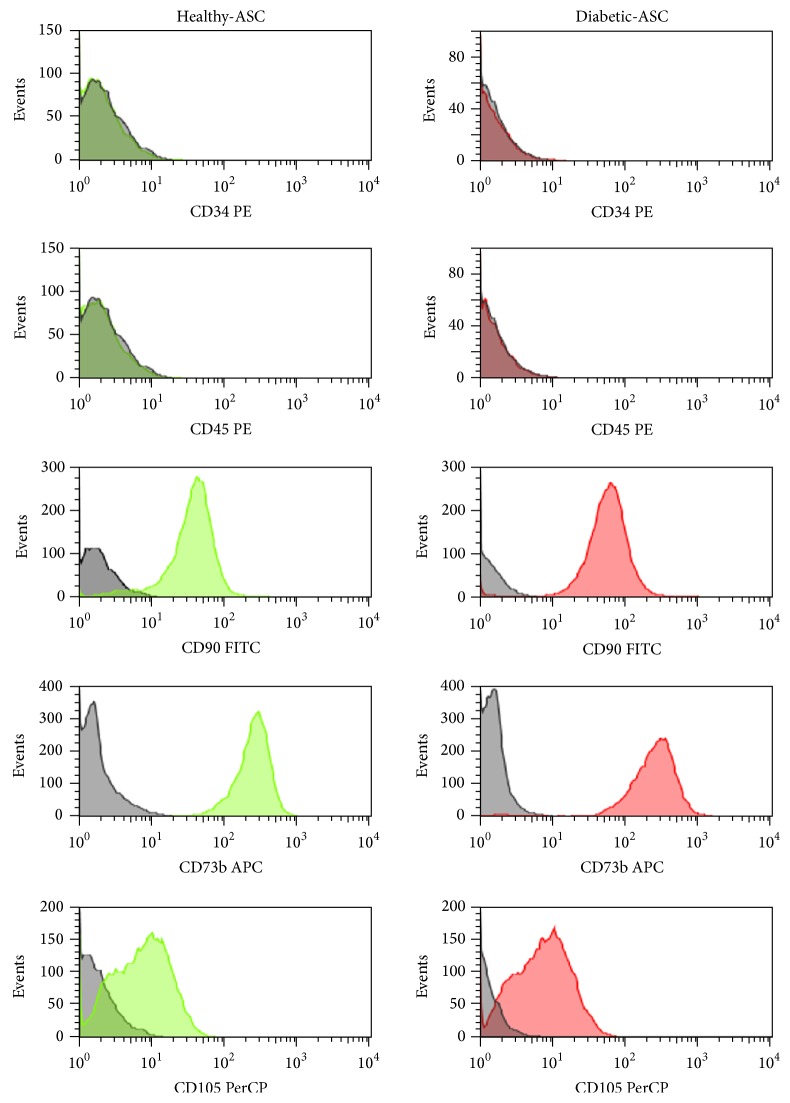
Figure 1.
Characterization of healthy and diabetic-ASC phenotype by fluorescence-activated cell sorting (FACS). Passage 3 ASCs were analysed by flow cytometry after staining with fluorophore-labelled antibodies directed against indicated cell-surface proteins (green and red peaks). Unstained cells served as negative control for the analysis (grey peaks). Both ASCs isolated from healthy and type 2 diabetic donors expressed CD90, CD73b, and CD105 but were negative for CD34 and CD45 markers.

