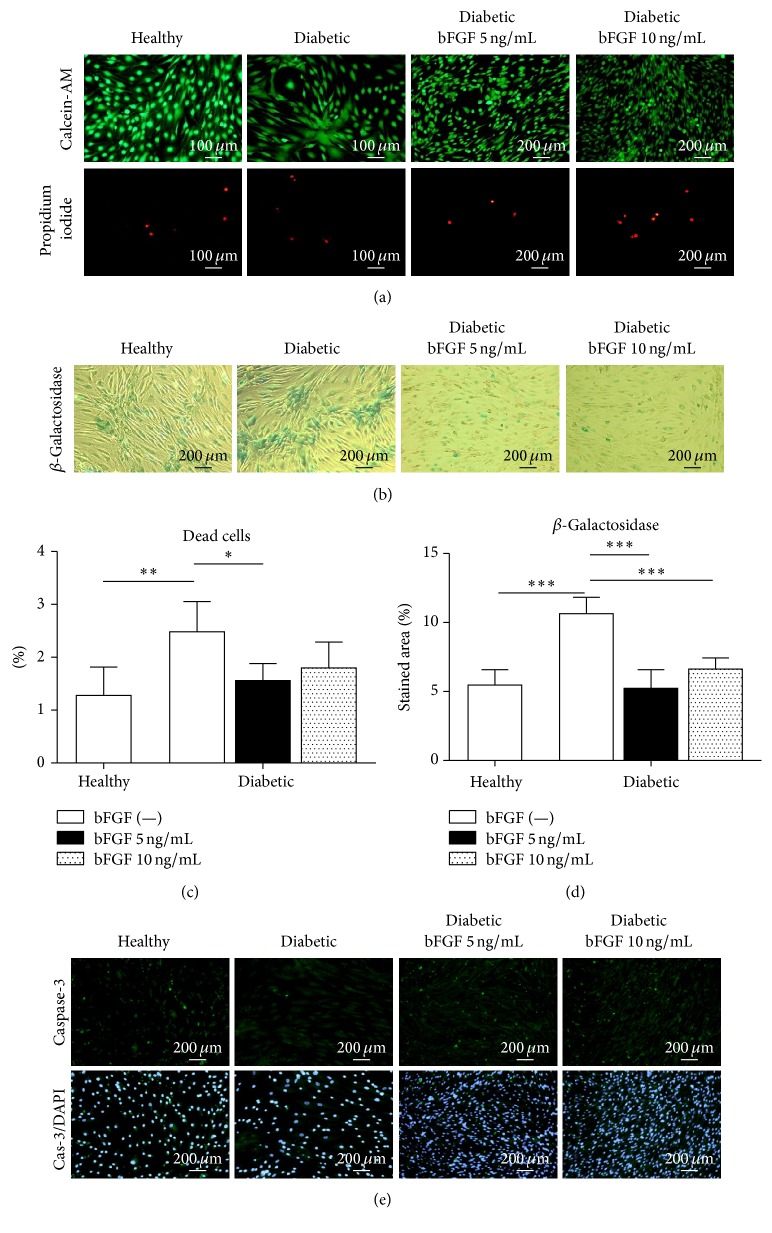
Figure 5.
Cellular senescence and apoptosis level in healthy and diabetic-ASCs cultured under standard conditions or exposed to various doses of bFGF. Viable and dead cells were visualized by simultaneous fluorescent staining with calcein-AM and propidium iodide solutions, respectively (a). Senescent cells in cultures were indicated by detection of senescence-associated β-galactosidase (b). Proportion of dead cells was calculated on the basis of the image analysis of at least 10 representative shots of calcein-AM/propidium iodide double staining (c); similarly, the numerousness of senescent cells was determined by quantification of SA-βgal stained area (d). Additionally, apoptotic cells were identified by immunofluorescent staining of active caspase-3; nuclei were counterstained with DAPI (e). ∗p value <0.05, ∗∗p value <0.01, and ∗∗∗p value <0.001.

