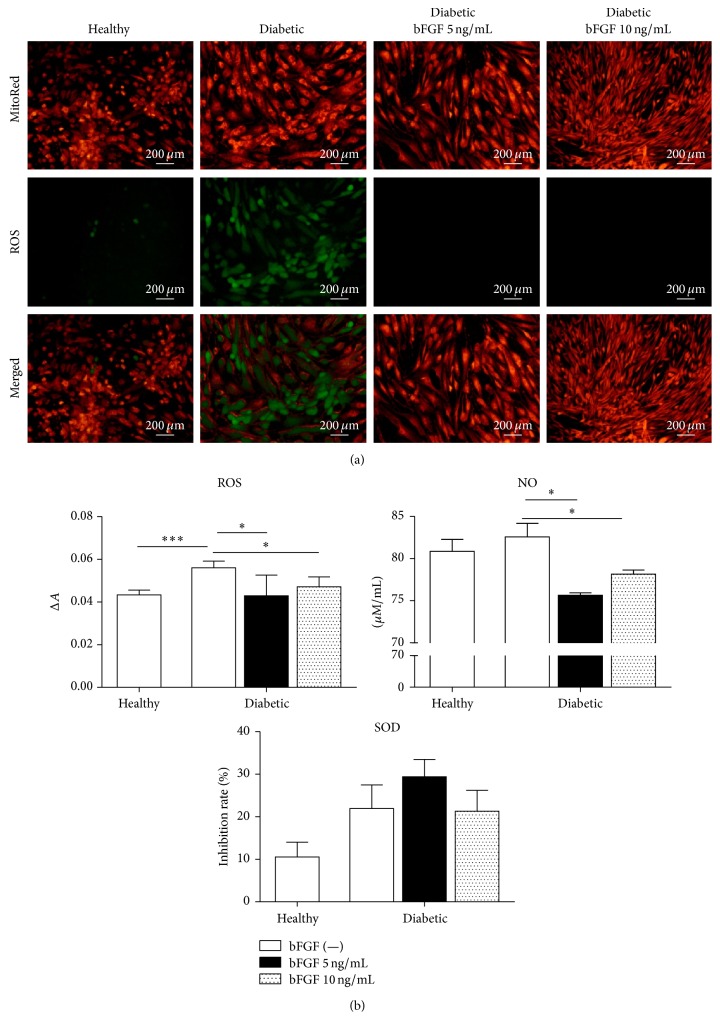
Figure 7.
Changes in oxidative stress level in diabetic-ASCs after exposition to bFGF in a concentration of 5 ng/mL or 10 ng/mL with reference to nontreated healthy and diabetic-ASC controls. Detection of intracellular ROS along with mitochondria localization via MitoRed stain in investigated cultures by fluorescence microscopy (a). Quantification of extracellular ROS, NO, and SOD levels (b). ∗p value <0.05 and ∗∗∗p value <0.001.

