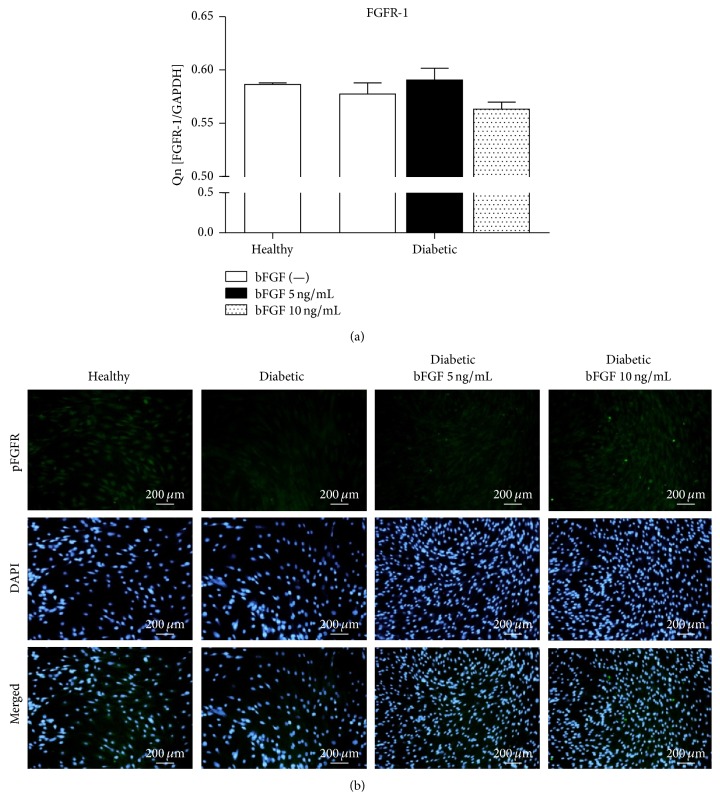
Figure 8.
Analysis of FGFR-1 mRNA and phosphorylated receptor levels in investigated ASCs. FGFR-1 gene expression was evaluated by real-time RT-PCR (a). Activated FGFR-1 phosphorylated at Y653/Y654 was additionally detected with the use of anti-phospho-FGFR-1 antibody; nuclei were counterstained with DAPI (b). Magnification: ×100.

