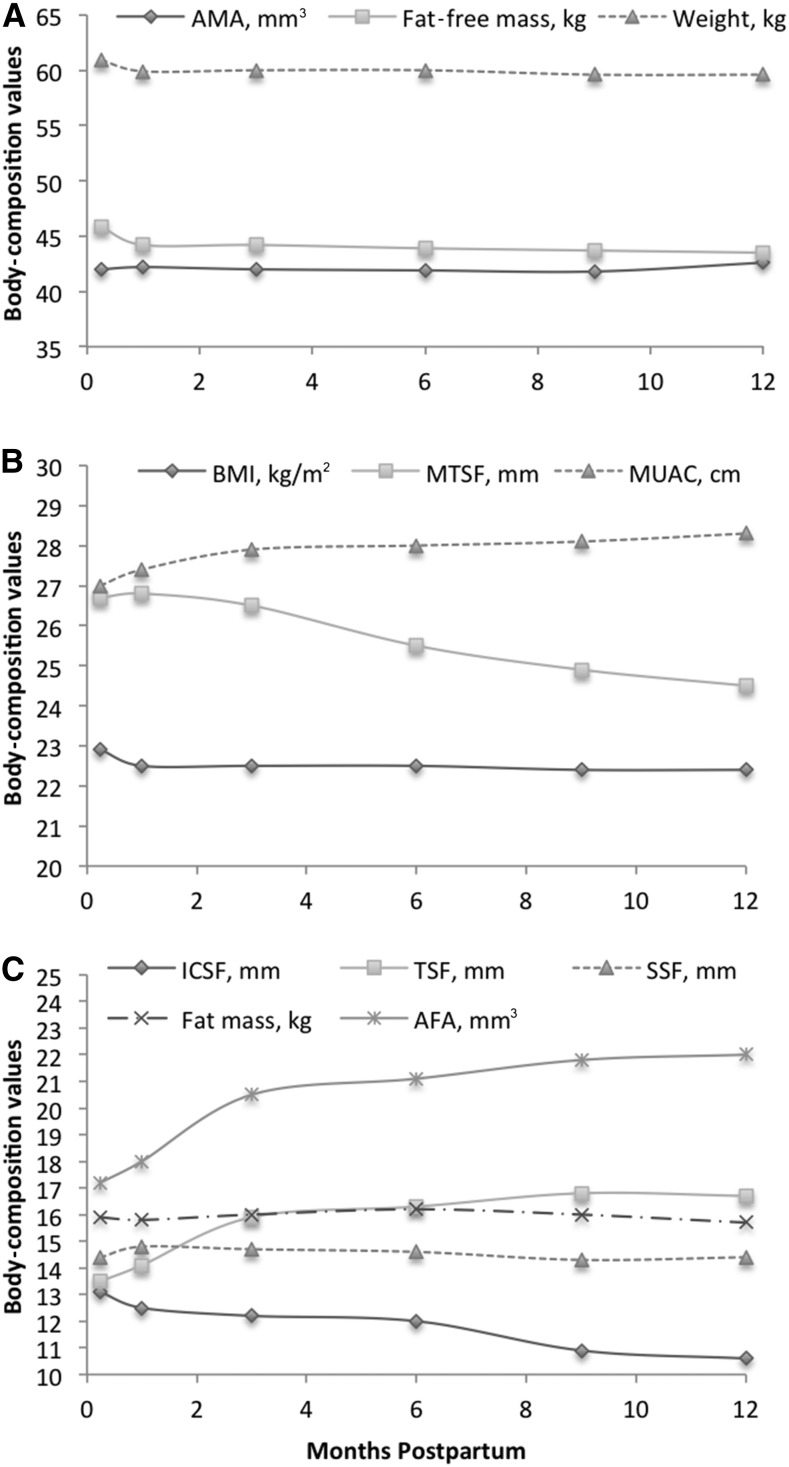
FIGURE 2.
Mean body-composition values from 1 wk to 12 mo in HIV-positive and HIV-negative Ugandan women (n = 246). Values are for AMA, fat-free mass, and weight (A); BMI, MTSF, and MUAC (B); and ICSF, TDF, SSF, fat mass, and AFA (C). AFA, arm fat area; AMA, arm muscle area; ICSF, iliac crest skinfold thickness; MTSF, midthigh skinfold thickness; MUAC, midupper arm circumference; SSF, subscapular skinfold thickness; TSF, triceps skinfold thickness.

