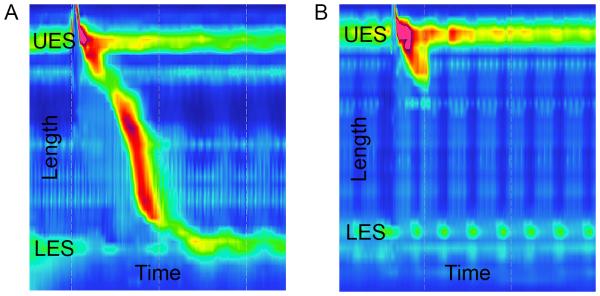
Figure 1.
Esophageal manometry images for a normal control patient (A) and a patient with systemic sclerosis (B) are shown. The y-axis shows the length measured in the esophagus, including the location of the upper esophageal sphincter (UES) and lower esophageal sphincter (LES). The x-axis shows the time of the recording that captured one swallow. In (A), the diagonal region with topographical color change shows a normal swallow with distal propagation of esophageal peristalsis with time and corresponding LES relaxation. In (B), esophageal peristalsis is notably absent from the distal two-thirds of the esophagus, and resting LES pressure is low.

