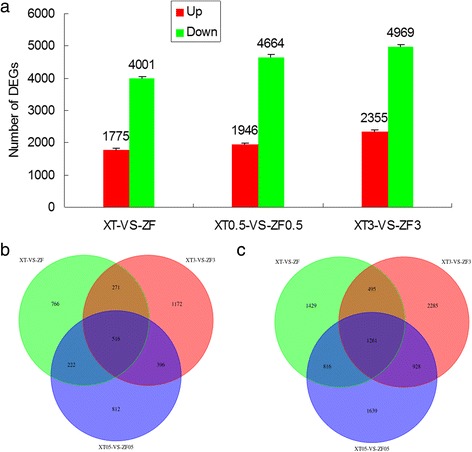
Fig. 2.

Gene expression profile of different maize genotypes in response to heat stress. a The total number of up-regulated and down-regulated genes. b Venn diagram of up-regulated genes. c Venn diagram of down-regulated genes. Three independent experimental replicates were analyzed for each sample, and data were indicated as mean ± SE (n = 3). XT: Xiantian 5; ZF: Zhefengtian 2. XT-ZF, XT0.5 –ZF0.5 and XT3-ZF3 represent XT-ZF seedlings treated at 42 °C for 0, 0.5, 3 h, respectively
