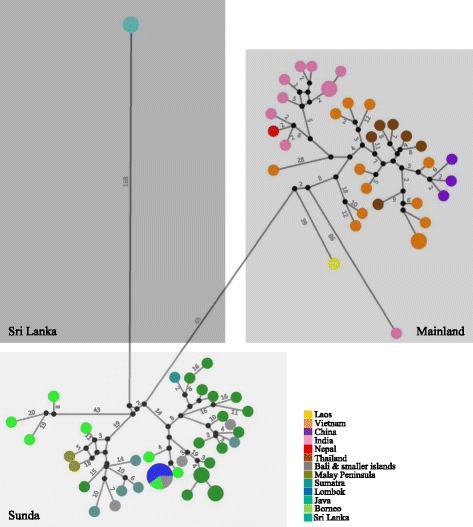
Fig. 2.

Median joining network of full mitogenome of all archival and contemporaneous red muntjac samples. Circle size is proportional to haplotype frequencies; fill color denotes geographical origin; lines represent one mutational step, except when indicated otherwise with numbers. Black circles represent missing vectors. The three major clades are denoted in the different boxes and indicated by name
