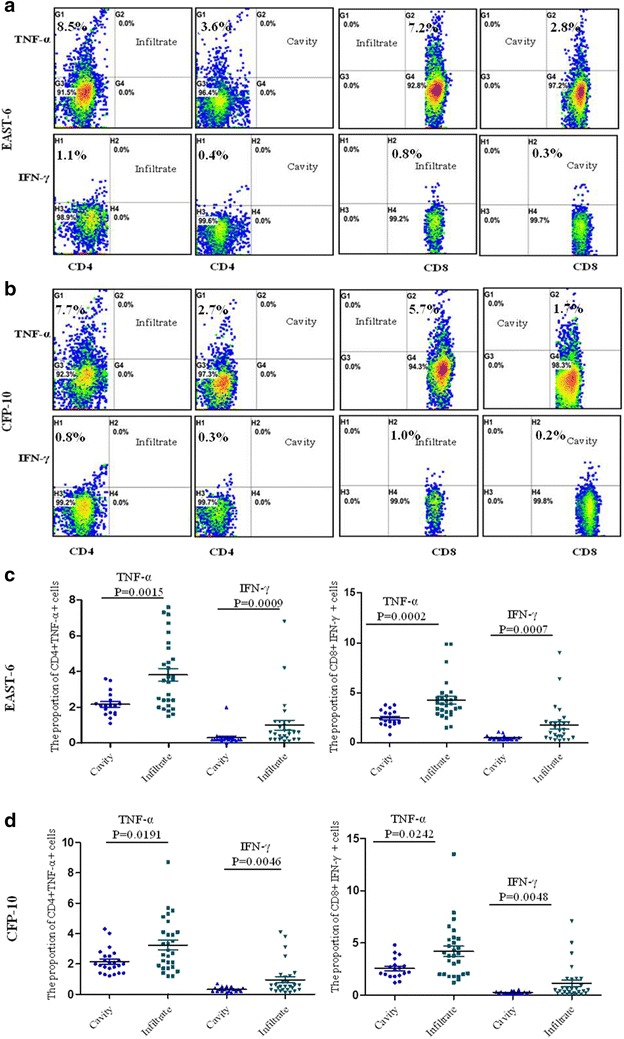
Fig. 1.

Flow cytometry dot plots of MTB-specific CD4+ and CD8+ T-lymphocyte responses in cavitary and infiltrative TB by intracellular TNF-α and IFN-γ staining. a Subject with predominant CD4 and CD8 response to EAST-6. b Subject with both CD4 and CD8 responses to CFP-10. The percentages in the upper left quadrant denote the percentage of CD4+ TNF-α- or IFN-γ-positive cells; the right upper quadrant demonstrates the percentages of CD8 lymphocytes producing TNF-α or IFN-γ cells. Plots of the compared pairs are from the same patient. c, d Nonparametric t-testing (Mann–Whitney test) was performed and P < 0.05 was considered to be a significant statistical difference
