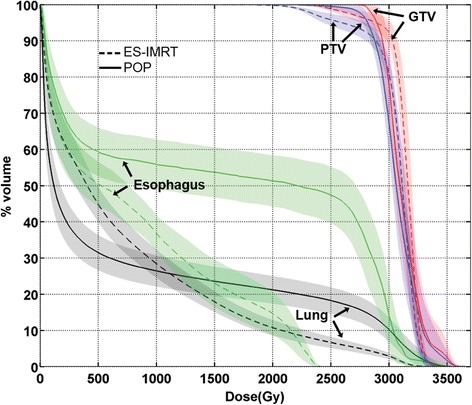
Fig. 2.

Average cumulative dose-volume line plots of the GTV (red), PTV (blue), esophagus (green), and lung (black) are shown for the clinically delivered POP plans (solid line) compared to the ES-IMRT optimized plans (dashed line) for the 15 patients meeting the inclusion criteria. The shaded envelope surrounding each line plot represents one standard deviation
